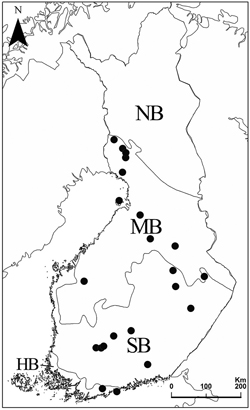
Fig. 1. Vegetation zones and the locations of the 22 forest areas. HB = hemiboreal, SB = southern boreal, MB = middle boreal, and NB = northern boreal zone.
| Table 1. Dead-wood (CWD) tree species, total numbers of CWD units, the mean numbers and standard deviations of each tree species CWD in study areas, and polypore numbers found on them. | ||||||
| Tree species | Total no. of CWD units | Mean (SD) no. of CWD units/ha | Polypore occurrences | Polypore species | Unique species | Red-listed species |
| Acer platanoides | 4 | 0.08 (0.4) | 2 | 2 | 0 | 0 |
| Alnus glutinosa | 219 | 3.7 (16.3) | 152 | 20 | 1 | 1 |
| Alnus incana | 944 | 25.7 (61.7) | 264 | 30 | 1 | 1 |
| Betula spp. | 1054 | 19.4 (23.5) | 932 | 41 | 8 | 2 |
| Corylus avellana | 1 | 0.03 (0.2) | 1 | 1 | 0 | 0 |
| Juniper communis | 3 | 0.07 (0.3) | 0 | 0 | 0 | 0 |
| Picea abies | 1399 | 24.2 (25.8) | 993 | 44 | 16 | 6 |
| Pinus sylvestris | 274 | 5.1 (10.2) | 103 | 24 | 4 | 1 |
| Populus tremula | 242 | 4.5 (10.0) | 163 | 20 | 6 | 2 |
| Prunus padus | 54 | 0.9 (2.7) | 28 | 10 | 0 | 0 |
| Salix caprea | 298 | 5.8 (13.1) | 147 | 24 | 2 | 1 |
| Salix spp. | 12 | 0.7 (4.9) | 4 | 2 | 0 | 0 |
| Sorbus aucuparia | 131 | 2.4 (6.8) | 31 | 15 | 1 | 1 |
| Tilia cordata | 11 | 0.2 (0.8) | 3 | 2 | 0 | 0 |
| Unidentified | 56 | 1.2 (5.0) | 2 | 3 | 0 | 0 |
| Unidentified conifer | 43 | 1.1 (4.1) | 3 | 3 | 0 | 0 |
| Unidentified deciduous | 56 | 1.1 (2.8) | 4 | 4 | 0 | 0 |
| Total | 4797 | 96.2 (77.2) | 2832 | 101 | 39 | 12 |
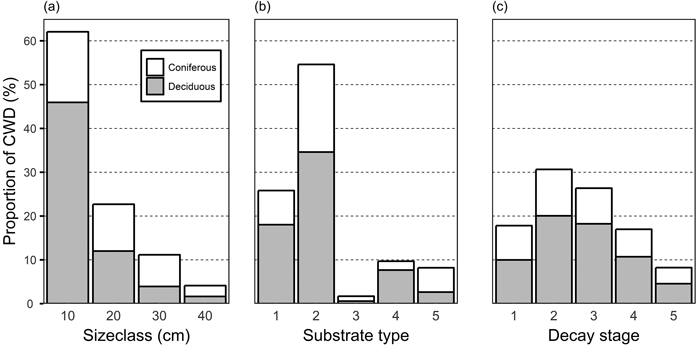
Fig. 2. Proportion of coniferous and deciduous coarse woody debris (CWD) among size classes (a), substrate types (b), and decay stages (c). Substrate types: 1, standing dead trees and >1.3 m high snags; 2: downed intact and broken logs; 3: branches and roots; 5: natural stumps, <1.3 m high; 6: logging residual and man-made stumps, logs, and bolts. CWD items not identified as either coniferous or deciduous are not displayed.
| Table 2. Spearman rank-order correlation coefficients between stand-scale variables, percentage of coarse woody debris (CWD) items inhabited by polypores, polypore species richness, number of occurrences, red-listed species richness and polypore diversity. | ||||||||||
| N coordinate | Area | CWD total | CWD/ha | CWD30/ha | CWD diversity | Inhabited | Species richness | Occurrences | Red-listed species | |
| Area | –0.12 | |||||||||
| CWD total | 0.27* | 0.23 | ||||||||
| CWD/ha | 0.33** | –0.47*** | 0.72*** | |||||||
| CWD30/ha | –0.34** | –0.03 | 0.16 | 0.14 | ||||||
| CWD diversity | –0.16 | 0.26* | 0.53*** | 0.31** | 0.32** | |||||
| Inhabited | –0.54*** | 0.01 | –0.42*** | –0.39*** | 0.27* | –0.18 | ||||
| Species richness | –0.42*** | 0.34** | 0.39*** | 0.13 | 0.38** | 0.64*** | 0.35** | |||
| Occurrences | –0.19 | 0.35** | 0.55*** | 0.27* | 0.30* | 0.46*** | 0.40*** | 0.78*** | ||
| Red-listed species | –0.07 | 0.18 | 0.07 | –0.10 | 0.28* | 0.09 | 0.23* | 0.26* | 0.19 | |
| Polypore diversity | –0.43*** | 0.20 | 0.25* | 0.07 | 0.39*** | 0.69*** | 0.12 | 0.85*** | 0.44*** | 0.17 |
| CWD total, total number of CWD items; CWD/ha, coarse woody debris items per hectare; CWD30/ha, number of CWD items with a diameter of >30 cm per hectare; Inhabited, percentage of CWD items inhabited; Occurrences, total number of polypore observations; Red-listed species, number of R-L species. * = p < 0.05; ** = p < 0.01; *** = p < 0.001. | ||||||||||
| Table 3. Summary of linear regression models for total polypore species richness. Variables used in the models were the diversity of coarse woody debris (CWD) items, northern coordinate, and number of large (diameter > 30 cm) CWD items per hectare. | ||||
| Variable | Coefficient | p | F1,69 | R2 |
| Diversity of CWD | 6.939 | <0.001 | 57.73 | 0.455 |
| N-coordinate | –1.039×10⁻⁵ | <0.001 | 13.76 | 0.166 |
| Large CWD per hectare | 0.187 | 0.006 | 8.05 | 0.105 |
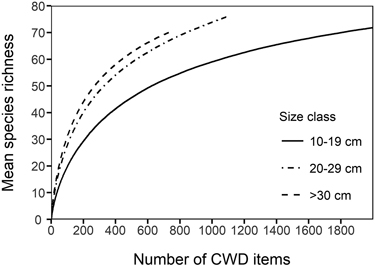
Fig. 3. Species accumulation curves for different size classes of coarse woody debris (CWD) items. The lines are mean (expected) number of species for a given number of CWD items sampled.
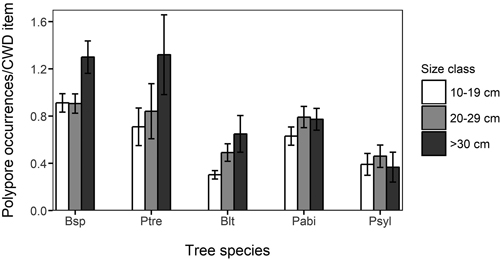
Fig. 4. Mean number of occurrences of polypores in different coarse woody debris (CWD) size classes and host tree species. The vertical lines indicate standard deviation. Bsp: Betula spp.;, Ptre: Populus tremula; Blt: Other deciduous trees, Pabi: Picea abies; Psyl: Pinus sylvestris.
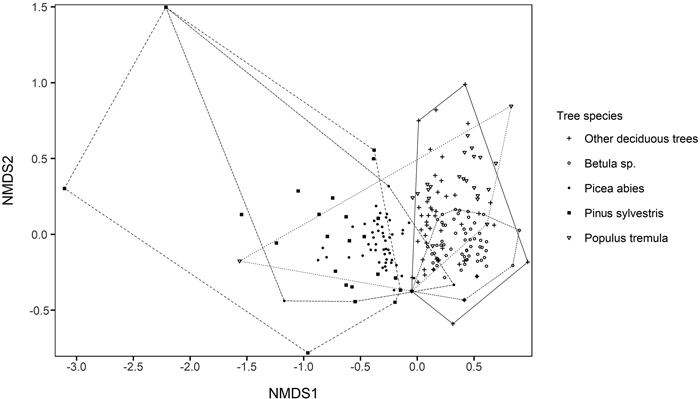
Fig. 5. Two-dimensional solution of non-metric multidimensional scaling (NMDS) ordination based on Bray-Curtis dissimilarities between polypore assemblages on different tree species in each forest stand. Stress value = 0.12. The polypore species scores of the NMDS solution are given in Supplementary file S3.
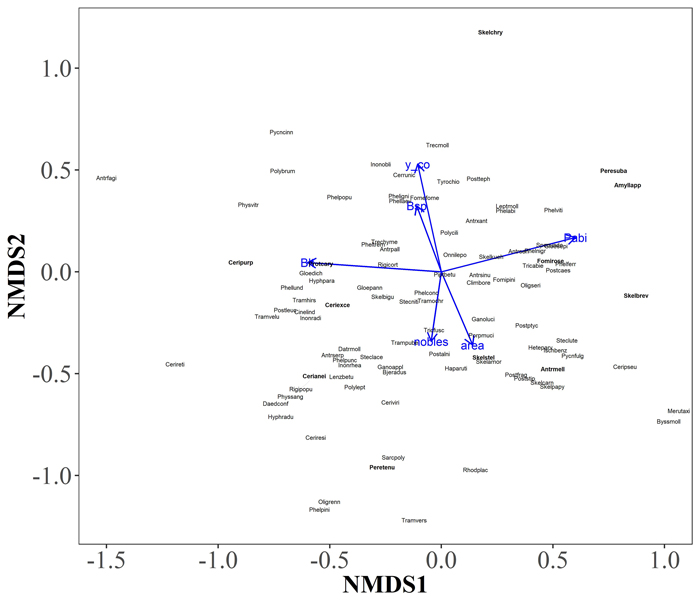
Fig. 6. A two-dimensional NMDS solution locating polypore species, and fitted environmental factors. Only environmental factors with p-value < 0.05 are displayed: Pabi, Picea abies (r = 0.39); Blt, other deciduous trees (r = 0.35); y_co, northern coordinate (r = 0.34); area, size of the surveyed area (r = 0.16); Bsp, Betula spp. (r = 0.13); nobles, so-called noble tree species (Tilia cordata, Acer platanoides and Corylus avellana) (r = 0.13). The tree species vectors are given as the number of coarse woody debris (CWD) of each tree species per hectare. Red-listed species are shown in bold. The polypore species scores of the NMDS solution are given in Supplementary file S4. View larger in new window/tab