| Table 1. Main stand characteristics of the study sites. H – average stand height, D1.3 – average breast height diameter, BA – basal area. | |||||||
| Study site | Age (yr) | Stand area (ha) | N (trees ha–1) | H (m) | D1,3 (cm) | BA (m2 ha–1) | Volume (m3 ha–1) |
| Downy birch | 30 | 5.1 | 1660 | 15 | 14 | 24.5 | 193 |
| Norway spruce | 55 | 0.9 | 942 | 17 | 18,4 | 25 | 208 |
| Scotch pine | 65 | 1.3 | 620 | 23 | 22 | 20.1 | 218 |
| Table 2. Soil characteristics of the studied stands. C – organic carbon (%), N – Kjeldahl nitrogen (%), P – available (AL) phosphorus (mg kg–1), K 620 available (AL) potassium (mg kg–1), average concentrations are presented for the upper 10 cm soil layer (n = 5), World Reference Base for soil resources (WRB). | |||||||||||
| Study site | Soil type (WRB 2006) | Peat layer depth (cm) | Soil bulk density (0–10 cm) | pH KCl | N % | C % | P mg/kg | K mg/kg | N storage (t ha–1) | C/N (0–10 cm) | |
| 0–10 cm | 0–40 cm | ||||||||||
| Downy birch | Drainic Eutric Histosol | >100 | 0.20 | 4.8 ± 0.01 | 2.6 ± 0.03 | 39.4 ± 1.01 | 44.8 ± 1.93 | 159.0 ± 2.94 | 5.1 | 19.9 | 15.3 |
| Norway spruce | Drainic Eutric Histosol | =45 | 0.18 | 4.4 ± 0.01 | 2.7 ± 0.04 | 33.5 ± 0.9 | 49.0 ± 7.18 | 186.9 ± 17.34 | 4.9 | 21.5 | 12.3 |
| Scotch pine | Drainic Mesic Histosol | =45 | 0.14 | 2.6 ± 0.05 | 1.4 ± 0.04 | 39.8 ± 1.3 | 147.9 ± 15.9 | 370.4 ± 44.76 | 1.9 | 10.6 | 29.0 |
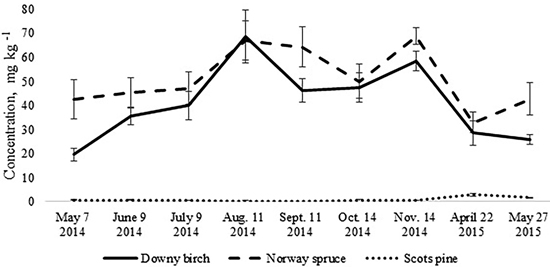
Fig. 1. Mean concentrations of soil mineral nitrogen in the upper 10 cm soil layer of birch, spruce and pine stand. Bars indicate the values of standard error, n=8 (24 replicates pooled by three).
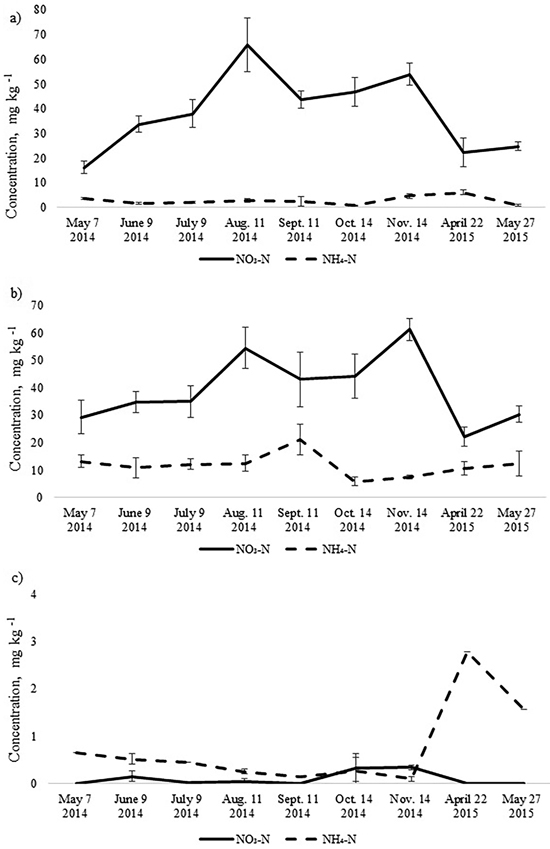
Fig. 2. Mean concentrations of soil NO3-N and NH4-N in the upper 10 cm soil layer of a) birch, b) spruce and c) pine stand. Bars indicate the values of standard error, n=8 (24 replicates pooled by three).
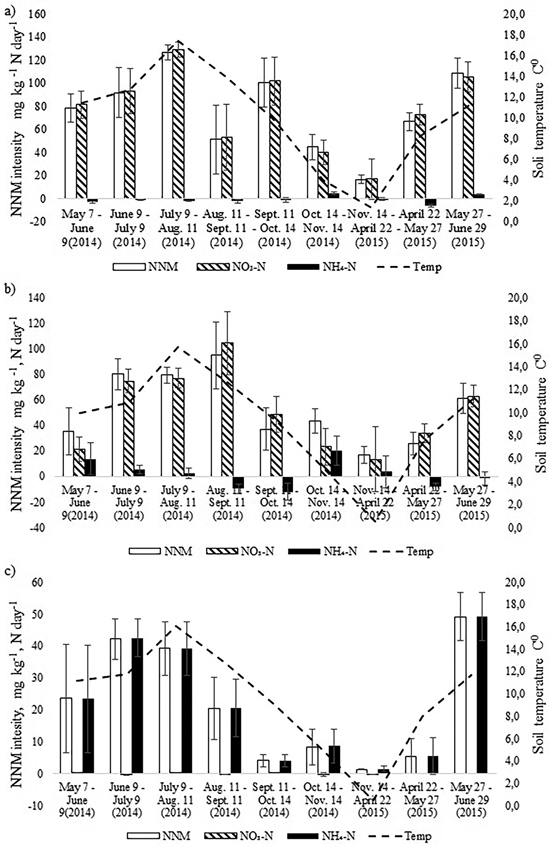
Fig. 3. Dynamics of monthly average soil temperature in the upper 10 cm soil layer and the dynamics of net nitrogen mineralization (NNM) intensity (mg kg–1 N day–1) in the a) birch, b) spruce and c) pine stand in 2014–2015. Bars indicate the values of standard error.
| Table 3. Annual net nitrification (NO3-N), annual net ammonification (NH4-N), total net nitrogen mineralization (NNM) (kg ha–1) and the share of net nitrification (%) in the studied stands. | ||||
| Study site | NO3-N ha | NH4-N ha | NNM | Nitrification |
| Downy birch | 129.3 | –1.7 | 127.5 | 100.0 |
| Norway spruce | 83.3 | 4.4 | 87.7 | 94.9 |
| Scots pine | –0.1 | 11.8 | 11.8 | 0.0 |
| Table 4. Litter characteristics of the studied stands (n = 7). | ||||||||||
| Stand | Leaves (t ha–1) | Needles (t ha–1) | Branches (t ha–1) | Other (t ha–1) | Total | N concentration (%) | N input (kg ha–1) | C/N | ||
| Leaves | Needles | Leaves | Needles | |||||||
| Birch | 3.1 | 0.4 | 0.1 | 3.7 ± 0.18 | 1.14 | 35.7 | 42 | |||
| Spruce | 0.8 | 2.0 | 0.9 | 0.6 | 4.3 ± 0.16 | 1.11 | 0.80 | 24.9 | 59 | |
| Pine | 0.3 | 2.1 | 0.5 | 0.9 | 3.8 ± 0.15 | 0.96 | 0.34 | 10.0 | 157 | |