| Table 1. Description of the study sites for a study on logging effects on soil N in Latvia. SOH - stem-only harvesting, with slash and stumps remaining at the site; WTH - whole‐tree harvesting with slash removed; WTH + SB - whole‐tree harvesting, with both slash and stumps removed; C - control sites without harvesting; SRC - short-rotation coppice. | ||||||||
| Site number | Site name | Coordinates | Average annual precipitation amount, mm | Mean annual air temperature, °C | Mean temperature of coldest month, °C | Mean temperature of warmest month, °C | Site type/ Dominant tree species before harvesting | Type/year of harvesting |
| 1 | Hylocomiosa (Vilkukalns) | 56°44´N, 25°54´E | 790 | 7.0 | –7.0 (January) | +17.1 (July) | Hylocomiosa/ Pinus sylvestris L. | SOH, WTH, C/ 2013 |
| 2 | Oxalidosa turf. mel. (Kudrenis) | 56°43´N, 25°52´E | 790 | 7.0 | –7.0 (January) | +17.1 (July) | Oxalidosa turf. mel./ Picea abies L. (Karst.) | SOH, WTH, C/ 2013 |
| 3 | Myrtillosa (Zveri) | 56°40´N, 25°50´E | 790 | 7.0 | –7.0 (January) | +17.1 (July) | Myrtillosa/ Pinus sylvestris L. | SOH, WTH, C/ 2013 |
| 4 | Hylocomiosa (Rembate) | 56°47´N, 24°45´E | 789 | 7.5 | –4.9 (January) | +18.8 (July) | Hylocomiosa/ Picea abies L. (Karst.) | WTH, WTH + SB/ 2012 |
| 5 | Hylocomiosa (Dursupe) | 57°11´N, 22°56´E | 671 | 7.3 | –5.2 (January) | +17.9 (July) | Hylocomiosa/ Picea abies L. (Karst.) | WTH, WTH + SB/ 2012 |
| 6 | Hylocomiosa (Nitaure) | 57°06´N, 25°09´E | 927 | 6.7 | –5.1 (January) | +18.5 (July) | Hylocomiosa/ Picea abies L. (Karst.) | WTH, WTH + SB/ 2012 |
| 7 | Hybrid aspen SRC | 56°42´N, 25°08´E | 790 | 7.0 | –5.7 (January) | +18.5 (July) | SRC/ Populus tremula L. × P. tremuloides Michx. | WTH, C/ 2015 |
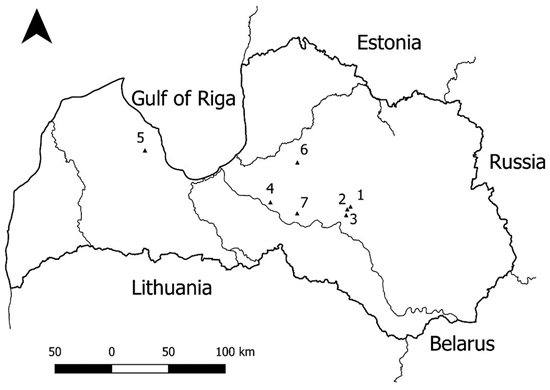
Fig. 1. Location of the study sites. 1 – Hylocomiosa (Vilkukalns); 2 – Oxalidosa turf. mel. (Kudrenis); 3 – Myrtillosa (Zveri); 4 – Hylocomiosa (Rembate); 5 – Hylocomiosa (Dursupe); 6 – Hylocomiosa (Nitaure); 7 – Hybrid aspen SRC. A study on logging effects on soil N in Latvia.
| Table 2. Experimental setup in the sites for a study on logging effects on soil N in Latvia. | ||||||
| Site number | Site name | Type of management after harvesting | Subplots | Date of installation of lysimeters | Sampling design | Frequency of soil solution sampling |
| 1 | Hylocomiosa (Vilkukalns) | Reforestation with Pinus sylvestris L. | Three subplots per site: WTH, SOH, C | autumn 2011 | three pairs of lysimeters at 2 depths (30 and 60 cm) per subplot | twice per month in 2013–2015 and once per month in 2016 and 2017 |
| 2 | Oxalidosa turf. mel. (Kudrenis) | Reforestation with Picea abies (L.) Karst. | ||||
| 3 | Myrtillosa (Zveri) | Reforestation with Pinus sylvestris L. | ||||
| 4 | Hylocomiosa (Rembate) | Reforestation with Picea abies (L.) Karst. and Alnus glutinosa (L.) Gaertn. | Two subplots per site: WTH + SB, WTH | spring 2014 | two pairs of suction tube lysimeters at 2 depths (30 and 60 cm) per subplot | twice per month in 2014 and 2015 and once per month in 2016 and 2017 |
| 5 | Hylocomiosa (Dursupe) | Reforestation with Picea abies (L.) Karst. | ||||
| 6 | Hylocomiosa (Nitaure) | Reforestation with Picea abies (L.) Karst. | ||||
| 7 | Hybrid aspen SRC | Regeneration with P. tremula L.× P. tremuloides Michx. | Four subplots per site: WS, WA, D, C | summer 2011 | one pair of suction tube lysimeters at 2 depths (30 and 60 cm) per subplot | twice per month in 2014 and 2015 and once per month in 2016 and 2017 |
| WTH - whole‐tree harvesting with slash removed; SOH - stem-only harvesting with slash and stumps remaining at the site; C - control sites without harvesting; WTH + SB - whole‐tree harvesting, with both slash and stumps removed; SRC - short-rotation coppice. C - control plot (without fertilisation); WA - initially fertilised with wood ash; WS - initially fertilised with wastewater sludge; D - initially fertilised with digestate. | ||||||
| Table 3. Soil description of the sites for a study on logging effects on soil N in Latvia. | ||||||||||
| Site number | Site name | Soil type | Soil type (WRB*) | Soil texture (FAO) | Total C concentration, g kg–1 | Total N concentration, g kg–1 | ||||
| O horizon | 0–40 cm | 40–80 cm | O horizon | 0–40 cm | 40–80 cm | |||||
| 1 | Hylocomiosa (Vilkukalns) | mineral | Folic Umbrisols (Albic, Hyperdystric, Arenic) | sand | 545.4 | 7.8 | 3.9 | 15.5 | 0.2 | 0.2 |
| 2 | Oxalidosa turf. mel. (Kudrenis) | drained peat** | Rheic Histosols (Eutric, Drainic) | sand | 555.4 | 104.6 | 46.1 | 22.1 | 5.6 | 2.4 |
| 3 | Myrtillosa (Zveri) | mineral | Albic Arenosols (Dystric) | sandy loam | 422.1 | 7.2 | 2.9 | 11.3 | 0.3 | 0.1 |
| 4 | Hylocomiosa (Rembate) | mineral | Folic Albic Podzols | sand at 0–30 cm; sandy loam at 30–45 cm; sand at 45–80 cm depth | 331.9 | 50.4 | 5.0 | 12.9 | 1.7 | 0.2 |
| 5 | Hylocomiosa (Dursupe) | mineral | Orsteinic Albic Folic Podzols | sand | 320.4 | 9.5 | 5.6 | 9.6 | 0.3 | 0.1 |
| 6 | Hylocomiosa (Nitaure) | mineral | Folic Arenosols | sand | 452.0 | 13.9 | 5.2 | 14.8 | 0.5 | 0.1 |
| 7 | Hybrid aspen SRC | mineral | Luvic Stagnic Phaeozem (Hypoalbic) and Mollic Stagnosol (Ruptic, Calcaric, Endosiltic) | loam at 0–20 cm depth; sandy loam at 20–80 cm depth | - | 17.7 | 7.2 | - | 1.3 | 0.3 |
| * - IUSS Working Group WRB (2006). World reference base for soil resources 2006. World Soil Resources Reports No. 103. FAO, Rome. ** - drainage was carried out in 1960. | ||||||||||
| Table 4. Macronutrient input through fertilisation in the hybrid aspen short-rotation coppice site in a study on logging effects on soil N in Latvia. | |||
| Fertilizer | Ntotal, kg ha–1 | Ptotal, kg ha–1 | Ktotal, kg ha–1 |
| Wood ash | 2.6 | 65 | 190 |
| Sewage sludge | 259 | 163 | 22 |
| Digestate | 69 | 1.2 | 99 |
| Table 5. Mean annual NO3–-N, NH4+-N and total N concentrations in the soil solution in the sites where above-ground biomass was harvested in a study on logging effects on soil N in Latvia. | |||||||||
| Year | Hylocomiosa (Vilkukalns) | Oxalidosa turf. mel. (Kudrenis) | Myrtillosa (Zveri) | ||||||
| SOH | WTH | C | SOH | WTH | C | SOH | WTH | C | |
| NO3–-N concentration in soil solution ± standard error, mg l–1 | |||||||||
| 2013 | 1.66* ± 0.38 | 1.51 ± 0.47 | 0.38 ± 0.14 | 1.41** ± 0.34 | 7.62* ± 1.24 | 0.84 ± 0.18 | 2.98* ± 0.47 | 1.99* ± 0.33 | 0.13 ± 0.02 |
| 2014 | 5.49* ± 0.61 | 6.46* ± 0.61 | 0.11 ± 0.04 | 0.96** ± 0.31 | 10.72* ± 1.59 | 0.80 ± 0.19 | 5.82*/** ± 0.61 | 1.10* ± 0.26 | 0.10 ± 0.03 |
| 2015 | 6.18*/** ± 0.57 | 8.74* ± 0.59 | 0.01 ± 0.01 | 0.96** ± 0.27 | 6.43* ± 1.15 | 0.98 ± 0.33 | 5.25*/** ± 0.56 | 0.56* ± 0.18 | 0.02 ± 0.01 |
| 2016 | 2.31*/** ± 0.34 | 5.52* ± 0.73 | 0.01 ± 0.01 | 0.89*/** ± 0.29 | 1.99 ± 0.48 | 1.91 ± 0.46 | 4.75*/** ± 0.71 | 0.13* ± 0.05 | 0.02 ± 0.01 |
| 2017 | 0.66*/** ± 0.27 | 2.02* ± 0.41 | 0.02 ± 0.01 | 0.99*/** ± 0.35 | 0.63 ± 0.17 | 1.38 ± 0.26 | 1.96*/** ± 0.42 | 0.59 ± 0.56 | 0.05 ± 0.02 |
| 2018 | 1.03* ± 0.45 | 2.52* ± 1.35 | 0.01 ± 0.01 | 1.70 ± 0.46 | 3.42 ± 1.60 | 2.08 ± 0.60 | 2.73* ± 1.41 | 0.02 ± 0.02 | 0.03 ± 0.01 |
| NH4+-N concentration in soil solutio ± standard error, mg l–1 | |||||||||
| 2013 | 0.23 ± 0.10 | 0.08 ± 0.03 | 0.11 ± 0.07 | 0.03** ± 0.01 | 0.15* ± 0.04 | 0.02 ± 0.01 | 0.02 ± 0.01 | 0.02 ± 0.01 | 0.02 ± 0.01 |
| 2014 | 0.39* ± 0.11 | 0.43* ± 0.18 | 0.65 ± 0.58 | 0.02** ± 0.01 | 0.31* ± 0.08 | 0.02 ± 0.01 | 0.23*/** ± 0.07 | 0.02 ± 0.01 | 0.03 ± 0.01 |
| 2015 | 0.13** ± 0.07 | 0.18 ± 0.06 | 0.19 ± 0.15 | 0.02*/** ± 0.01 | 0.15* ± 0.05 | 0.02 ± 0.01 | 0.03*/** ± 0.01 | 0.01 ± 0.01 | 0.02 ± 0.01 |
| 2016 | 0.04 ± 0.02 | 0.10 ± 0.05 | 0.03 ± 0.02 | 0.01** ± 0.01 | 0.13* ± 0.05 | 0.01 ± 0.01 | 0.01 ± 0.01 | 0.01 ± 0.01 | 0.01 ± 0.01 |
| 2017 | 0.03 ± 0.01 | 0.06 ± 0.02 | 0.01 ± 0.01 | 0.01** ± 0.05 | 0.13* ± 0.07 | 0.01 ± 0.01 | 0.02 ± 0.01 | 0.02 ± 0.01 | 0.03 ± 0.01 |
| 2018 | 0.01 ± 0.01 | 0.02 ± 0.01 | 0.01 ± 0.01 | 0.05* ± 0.03 | 0.04 ± 0.03 | 0.05 ± 0.02 | 0.01 ± 0.01 | 0.01 ± 0.01 | 0.02 ± 0.01 |
| TN concentration in soil solution ± standard error, mg l–1 | |||||||||
| 2013 | 3.17* ± 0.53 | 2.17 ± 0.45 | 1.03 ± 0.30 | 2.87** ± 0.41 | 12.27* ± 2.23 | 2.42 ± 0.29 | 3.73* ± 0.52 | 2.35* ± 0.34 | 0.38 ± 0.04 |
| 2014 | 9.36* ± 1.12 | 11.09 ± 1.64 | 1.43 ± 0.67 | 2.57** ± 0.46 | 15.16* ± 1.62 | 2.56 ± 0.27 | 7.84*/** ± 0.73 | 1.74* ± 0.33 | 0.89 ± 0.50 |
| 2015 | 6.54*/** ± 0.60 | 9.24* ± 0.61 | 1.06 ± 0.39 | 1.98** ± 0.29 | 7.89* ± 1.01 | 2.02 ± 0.33 | 5.69*/** ± 0.56 | 0.78* ± 0.16 | 0.30 ± 0.04 |
| 2016 | 2.82*/** ± 0.32 | 6.29* ± 0.74 | 0.86 ± 0.15 | 2.02*/** ± 0.32 | 3.28 ± 0.54 | 3.01 ± 0.47 | 5.16*/** ± 0.75 | 0.41 ± 0.05 | 0.31 ± 0.03 |
| 2017 | 1.24** ± 0.46 | 2.28* ± 0.39 | 0.74 ± 0.18 | 1.89* ± 0.35 | 2.07 ± 0.35 | 2.39 ± 0.24 | 2.08*/** ± 0.41 | 0.88 ± 0.59 | 0.30 ± 0.05 |
| 2018 | 1.83 ± 0.41 | 3.58 ± 1.61 | 0.82 ± 0.27 | 2.80* ± 0.52 | 5.21 ± 1.51 | 3.69 ± 0.61 | 3.21 ± 1.51 | 0.69 ± 0.18 | 1.77 ± 0.01 |
| * - Statistically significant difference between treated (SOH or WTH) and control (C) subplots within year by the Wilcoxon rank sum test. ** - Statistically significant difference between SOH and WTH subplots within year by the Wilcoxon rank sum test. SOH - stem-only harvesting with slash and stumps remaining at the site; WTH - whole‐tree harvesting with slash removed; C - unharvested control. 2013 represents the first year after harvesting. | |||||||||
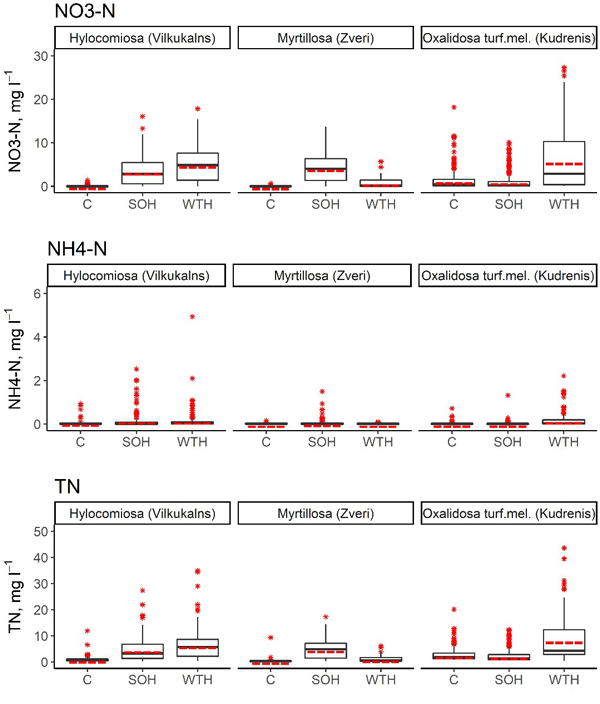
Fig. 2. Concentrations of NO3–-N, NH4+-N and total N in the soil solution in SOH (stem-only harvesting with slash and stumps remaining at the site), WTH (whole‐tree harvesting with both slash and stumps removed) and unharvested control subplots. In the boxplots, the median is shown by the black bold line, the mean is shown by the red dashed line, the box corresponds to the lower and upper quartiles, whiskers show the minimum and maximum values (within 150% of the interquartile range from the median) and red stars represent outliers of the datasets. A study on logging effects on soil N in Latvia.
| Table 6. P-values of the Wilcoxon rank sum test characterising the significance of statistical differences in mean annual NO3–-N, NH4+-N and total N concentration in the soil solution between SOH (stem-only harvesting with slash and stumps remaining at the site) or WTH (whole‐tree harvesting with slash removed) plots and C plots (control sites without harvesting). A study on logging effects on soil N in Latvia. | |||||||
| Site name | Subplot | 1st year (2013) | 2nd year (2014) | 3rd year (2015) | 4th year (2016) | 5th year (2017) | 6th year (2018) |
| NO3–-N concentration in soil solution | |||||||
| Hylocomiosa (Vilkukalns) | SOH | 0.033 | <0.001 | <0.001 | <0.001 | <0.001 | 0.009 |
| WTH | 0.110 | <0.001 | <0.001 | <0.001 | <0.001 | 0.002 | |
| Oxalidosa turf. mel. (Kudrenis) | SOH | 0.200 | 0.531 | 0.748 | 0.017 | <0.001 | 0.428 |
| WTH | <0.001 | <0.001 | <0.001 | 0.173 | 0.087 | 0.090 | |
| Myrtillosa (Zveri) | SOH | <0.001 | <0.001 | <0.001 | <0.001 | <0.001 | <0.001 |
| WTH | <0.001 | <0.001 | 0.001 | 0.002 | 0.999 | 0.799 | |
| NH4+-N concentration in soil solution | |||||||
| Hylocomiosa (Vilkukalns) | SOH | 0.220 | 0.034 | 0.061 | 0.888 | 0.587 | 0.999 |
| WTH | 0.285 | <0.001 | 0.518 | 0.583 | 0.229 | 0.877 | |
| Oxalidosa turf. mel. (Kudrenis) | SOH | 0.315 | 0.575 | 0.004 | 0.999 | 0.453 | 0.047 |
| WTH | 0.002 | <0.001 | 0.033 | 0.001 | 0.001 | 0.758 | |
| Myrtillosa (Zveri) | SOH | 0.566 | 0.007 | 0.045 | 0.306 | 0.121 | 0.286 |
| WTH | 0.357 | 0.405 | 0.468 | 0.054 | 0.267 | 0.277 | |
| TN concentration in soil solution | |||||||
| Hylocomiosa (Vilkukalns) | SOH | 0.013 | <0.001 | <0.001 | <0.001 | 0.275 | 0.071 |
| WTH | 0.061 | <0.001 | <0.001 | <0.001 | 0.003 | 0.053 | |
| Oxalidosa turf. mel. (Kudrenis) | SOH | 0.765 | 0.062 | 0.347 | 0.016 | 0.001 | 0.029 |
| WTH | <0.001 | <0.001 | <0.001 | 0.999 | 0.378 | 0.106 | |
| Myrtillosa (Zveri) | SOH | <0.001 | <0.001 | <0.001 | <0.001 | <0.001 | 0.197 |
| WTH | <0.001 | 0.001 | 0.047 | 0.198 | 0.540 | 0.291 | |
| Table 7. Mean annual NO3–-N, NH4+-N and total N concentrations in the soil solution in study sites where stumps were harvested (WTH + SB - all above-ground biomass (including slash) and stumps removed; WTH - only above-ground biomass (including slash) removed). 2014 represents the first year after harvesting. | ||||||
| Year | Hylocomiosa (Rembate) | Hylocomiosa (Dursupe) | Hylocomiosa (Nitaure) | |||
| WTH + SB | WTH | WTH + SB | WTH | WTH + SB | WTH | |
| NO3–-N concentration in soil solution ± standard error, mg l–1 | ||||||
| 2014 | 0.10 ± 0.05 | 0.09 ± 0.05 | 0.10 ± 0.07 | 0.05 ± 0.03 | 0.86 ± 0.29 | 1.69 ± 0.86 |
| 2015 | 0.01 ± 0.01 | 0.01 ± 0.01 | 0.02 ± 0.02 | 0.05 ± 0.02 | 0.49 ± 0.19 | 0.45 ± 0.24 |
| 2016 | 0.02 ± 0.01 | 0.01 ± 0.01 | 0.03 ± 0.02 | 0.05 ± 0.02 | 0.47 ± 0.18 | 0.42 ± 0.23 |
| 2017 | <0.01* | 0.05 ± 0.03 | 0.03 ± 0.02 | 0.06 ± 0.02 | 1.43* ± 0.54 | 0.09 ± 0.04 |
| 2018 | 0.01 ± 0.01 | <0.01 | <0.01 | <0.01 | 1.04 ± 0.67 | 0.10 ± 0.03 |
| NH4+-N concentration in soil solution ± standard error, mg l–1 | ||||||
| 2014 | 0.02 ± 0.01 | 0.01 ± 0.01 | 0.02* ± 0.01 | 0.81 ± 0.23 | 0.03 ± 0.01 | 0.15 ± 0.11 |
| 2015 | 0.01 ± 0.01 | 0.01 ± 0.01 | 0.23 ± 0.14 | 0.34 ± 0.08 | 0.01 ± 0.01 | 0.04 ± 0.02 |
| 2016 | 0.01 ± 0.01 | 0.01 ± 0.01 | 0.22 ± 0.13 | 0.33 ± 0.09 | 0.01 ± 0.01 | 0.04 ± 0.02 |
| 2017 | 0.21 ± 0.07 | 0.48 ± 0.07 | 0.17 ± 0.05 | 0.26 ± 0.13 | 0.32 ± 0.12 | 0.02 ± 0.01 |
| 2018 | 0.02 ± 0.01 | 0.04 ± 0.01 | 0.04 ± 0.01 | 0.04 ± 0.01 | 0.04 ± 0.03 | 0.01 ± 0.01 |
| TN concentration in soil solution ± standard error, mg l–1 | ||||||
| 2014 | 0.53 ± 0.05 | 0.50 ± 0.08 | 2.47 ± 0.75 | 2.18 ± 0.29 | 1.19 ± 0.23 | 2.77 ± 1.08 |
| 2015 | 0.36 ± 0.03 | 0.30 ± 0.03 | 1.82 ± 0.26 | 1.32 ± 0.20 | 0.80* ± 0.20 | 1.13 ± 0.23 |
| 2016 | 0.34 ± 0.18 | 0.26 ± 0.02 | 1.69 ± 0.24 | 1.23 ± 0.19 | 0.77 ± 0.19 | 1.01 ± 0.19 |
| 2017 | 0.76 ± 0.18 | 2.08 ± 0.65 | 1.52 ± 0.34 | 1.12 ± 0.17 | 2.76* ± 0.80 | 0.36 ± 0.04 |
| 2018 | 0.44 ± 0.04 | 0.52 ± 0.09 | 0.98 ± 0.28 | 0.59 ± 0.04 | 1.73 ± 0.70 | 0.43 ± 0.05 |
| * Statistically significant difference between WTH + SB and WTH subplots within year by the Wilcoxon rank sum test. | ||||||
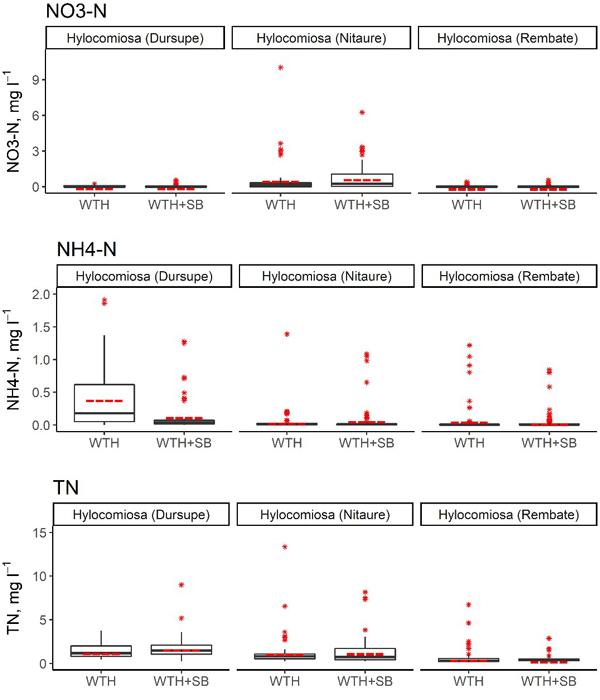
Fig. 3. Concentrations of NO3–-N, NH4+-N and total N in the soil solution in WTH + SB (above-ground biomass (including slash) and stumps harvested) and WTH (above-ground biomass (including slash) harvested). In the boxplots, the median is shown by the black bold line, the mean is shown by the red dashed line, the box corresponds to the lower and upper quartiles, whiskers show the minimal and maximal values (within 150% of the interquartile range from the median) and red stars represent outliers of the datasets. A study on logging effects on soil N in Latvia.
| Table 8. P-values of the Wilcoxon rank sum test characterising the significance of statistical differences in mean annual NO3–-N, NH4+-N and total N concentrations in the soil solution between WTH + SB (whole‐tree harvesting with both slash and stumps removed) and WTH (whole‐tree harvesting with slash removed) plots. | |||||
| Year after harvesting | 1st year (2014) | 2nd year (2015) | 3rd year (2016) | 4th year (2017) | 5th year (2018) |
| NO3–-N concentration in soil solution | |||||
| Hylocomiosa (Rembate) | 0.681 | 0.604 | 0.378 | 0.013 | 0.187 |
| Hylocomiosa (Dursupe) | 0.825 | 0.136 | 0.340 | 0.443 | 0.505 |
| Hylocomiosa (Nitaure) | 0.782 | 0.956 | 0.956 | 0.015 | 0.603 |
| NH4+-N concentration in soil solution | |||||
| Hylocomiosa (Rembate) | 0.828 | 0.874 | 0.781 | 0.379 | 0.812 |
| Hylocomiosa (Dursupe) | <0.001 | 0.276 | 0.276 | 0.999 | 0.857 |
| Hylocomiosa (Nitaure) | 0.253 | 0.201 | 0.253 | 0.143 | 0.999 |
| TN concentration in soil solution | |||||
| Hylocomiosa (Rembate) | 0.496 | 0.127 | 0.154 | 0.560 | 0.489 |
| Hylocomiosa (Dursupe) | 0.623 | 0.051 | 0.051 | 0.770 | 0.700 |
| Hylocomiosa (Nitaure) | 0.165 | 0.0362 | 0.053 | 0.001 | 0.167 |
| Table 9. Mean annual NO3–-N, NH4+-N and total N concentrations in the soil solution in the SRC site where different fertilisers were initially used. 2016 represents the first year after harvesting. | ||||||||
| Year | Digestate | Sewage sludge | Wood ash | Control (without fertilization) | ||||
| harvested | control | harvested | control | harvested | control | harvested | control | |
| NO3–-N concentration in soil solution ± standard error, mg l–1 | ||||||||
| 2016 | 0.03 ± 0.01 | 0.06 ± 0.03 | 0.02 ± 0.01 | 0.19 ± 0.09 | 0.03 ± 0.01 | 0.05 ± 0.03 | 0.06 ± 0.03 | 0.05 ± 0.03 |
| 2017 | 0.01 ± 0.01 | 0.17 ± 0.10 | 0.03 ± 0.01 | 0.02 ± 0.01 | 0.02 ± 0.02 | 0.05 ± 0.03 | 0.14 ± 0.06 | 0.02 ± 0.01 |
| 2018 | <0.01 | 0.18 ± 0.04 | 0.07 ± 0.06 | <0.01 | 0.50 ± 0.80 | 0.08 ± 0.03 | 0.19 ± 0.19 | 0.10 ± 0.03 |
| NH4+-N concentration in soil solution ± standard error, mg l–1 | ||||||||
| 2016 | 0.01 ± 0.01 | 0.02 ± 0.01 | 0.02 ± 0.01 | 0.05 ± 0.03 | 0.01 ± 0.01 | 0.01 ± 0.01 | 0.02 ± 0.01 | 0.01 ± 0.01 |
| 2017 | 0.02 ± 0.01 | 0.02 ± 0.01 | <0.01 | <0.01 | 0.01 ± 0.01 | 0.03 ± 0.01 | 0.01 ± 0.01 | 0.01 ± 0.01 |
| 2018 | <0.01 | 0.01 ± 0.01 | 0.03 ± 0.02 | <0.01 | <0.01 | <0.01 | <0.01 | 0.01 ± 0.01 |
| TN concentration in soil solution ± standard error, mg l–1 | ||||||||
| 2016 | 0.55* ± 0.06 | 1.12 ± 0.25 | 0.68* ± 0.05 | 1.23 ± 0.06 | 0.76* ± 0.04 | 0.59 ± 0.05 | 0.90 ± 0.08 | 0.77 ± 0.08 |
| 2017 | 0.42* ± 0.03 | 1.20 ± 0.12 | 0.69 ± 0.05 | 0.75 ± 0.07 | 0.66 ± 0.06 | 0.43 ± 0.05 | 0.84* ± 0.06 | 0.57 ± 0.06 |
| 2018 | 0.42 ± 0.11 | 0.87 ± 0.02 | 0.91 ± 0.24 | 0.99 ± 0.12 | 1.14 ± 0.42 | 0.30 ± 0.12 | 1.09 ± 0.27 | 0.85 ± 0.32 |
| * Statistically significant difference between harvested and control subplots within year by the Wilcoxon rank sum test. | ||||||||
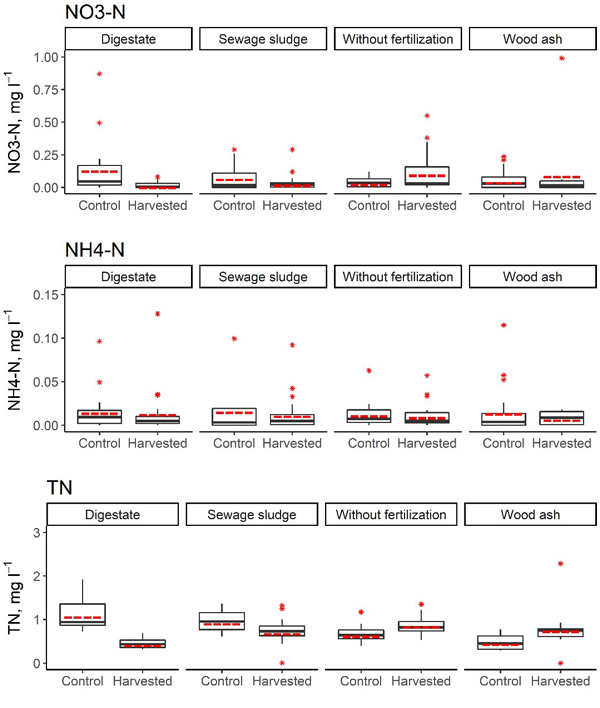
Fig. 4. Concentrations of NO3–-N, NH4+-N and total N in the soil solution in harvested and control subplots in the short-rotation coppice site with initial fertilisation. In the boxplots, the median is shown by the black bold line, the mean is shown by the red dashed line, the box corresponds to the lower and upper quartiles, whiskers show the minimal and maximal values (within 150% of the interquartile range from the median) and red stars represent outliers of the datasets. A study on logging effects on soil N in Latvia.
| Table 10. P-values of the Wilcoxon rank sum test characterising the significance of statistical differences between mean annual NO3–-N, NH4+-N and total N concentrations in the soil solution in harvested and unharvested plots. | ||||
| Year after harvesting | Type of fertilizer | |||
| Digestate | Sewage sludge | Wood ash | Control (without fertilization) | |
| NO3–-N concentration in soil solution | ||||
| 1st year (2016) | 0.668 | 0.246 | 0.999 | 0.999 |
| 2nd year (2017) | 0.175 | 0.520 | 0.564 | 0.181 |
| 2018 | 0.999 | 0.729 | 0.999 | 0.999 |
| NH4+-N concentration in soil solution | ||||
| 1st year (2016) | 0.133 | 0.304 | 0.067 | 0.667 |
| 2nd year (2017) | 0.563 | 0.999 | 0.604 | 0.999 |
| 2018 | 0.999 | 0.696 | 0.999 | 0.999 |
| TN concentration in soil solution | ||||
| 1st year (2016) | 0.014 | 0.022 | 0.032 | 0.517 |
| 2nd year (2017) | <0.001 | 0.839 | 0.054 | 0.011 |
| 2018 | 0.999 | 0.999 | 0.999 | 0.667 |