| Table 1. Description of the test site. |
| Placename | | San Rossore |
| Northing | | 43°41’33.08ˮN |
| Easting | | 10°18’30.44ˮE |
| Slope | % | 2 |
| Species | | Pinus pinea L. |
| Age | years | 21 |
| DBH | cm | 23.1 |
| Height | m | 10.7 |
| Operation | | 2nd thinning |
| Criteria | | Selection of candidates |
| Removal | % trees | 35–40 |
| Mechanization | level | Manual | Mechanized |
| System | type | WT | CTL | WT | CTL |
| Removal | trees ha–1 | 251a | 244a | 221a | 251a |
| Removal | t ha–1 | 51a | 29.6b | 53.9a | 33.5b |
| Tree size | kg tree–1 | 203a | 122b | 244a | 133b |
| Wood moisture content | % | 45.8a | 47.3a | 48.2a | 43.5a |
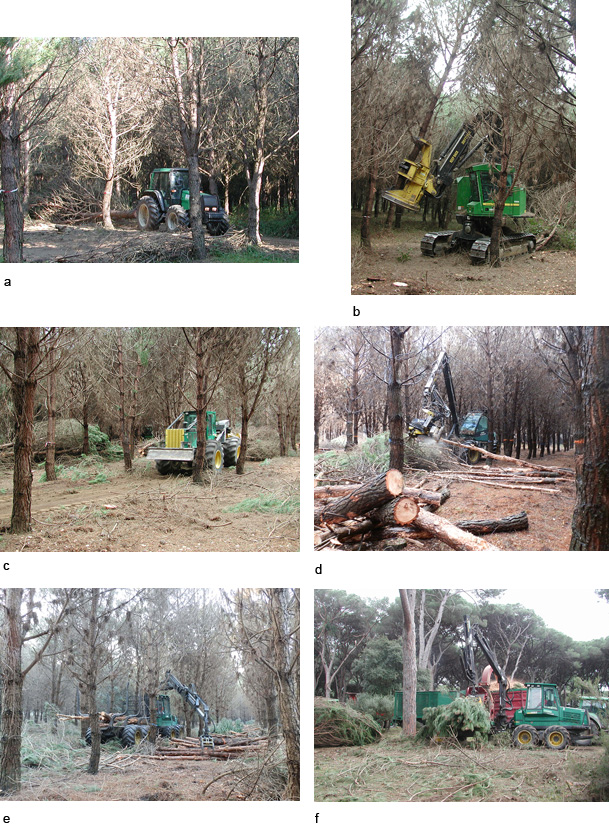
Fig. 1. Farm tractor (a); Feller-buncher (b); Skidder (c); Harvester (d); Forwarder (e); Chipper (f).
| Table 2. Technical charecteristics of the machines in the test. |
| System | WT | WT | CTL | CTL | WT/CTL | WT/CTL |
| Mechanization | level | Mechanized | Mechanized | Mechanized | Mechanized | Motor-manual | Both |
| Machine | type | Feller-buncher | Skidder | Harvester | Forwarder | Tractor | Chipper |
| Make | | John Deere | John Deere | John Deere | John Deere | Valtra | Erjo |
| Model | | 759J | 460D | 870B | 1110B | 6400 | 12/90 |
| Power | kW | 164 | 127 | 114 | 121 | 75 | 370/129 |
| Weight | t | 27770 | 12770 | 13800 | 13670 | 4170 | 30350 |
| Width | mm | 3050 | 2880 | 2510 | 2710 | 2340 | 2890 |
| Length | mm | 4410 | 7345 | 5435 | 10310 | 4440 | 10400 |
| Clearance | mm | 759 | 598 | 570 | 605 | 435 | 600 |
| Head make | | John Deere | - | John Deere | - | - | - |
| Head model | | FR21B | - | 746C | - | - | - |
| Cut capacity | mm | 508 | - | 500 | - | - | - |
| Table 3. Costing assumptions and machine rates. |
| Unit | Chainsaw | Tractor | Feller | Skidder | Harvester | Forwarder | Chipper |
| Utilization | % | 46 | 72 | 81 | 90 | 90 | 90 | 83 |
| Investment | Euro | 1500 | 55 000 | 320 000 | 180 000 | 300 000 | 240 000 | 500 000 |
| Resale | Euro | 450 | 16 500 | 96 000 | 54 000 | 90 000 | 72 000 | 150 000 |
| Service life | years | 2 | 10 | 10 | 10 | 10 | 10 | 10 |
| Utilization | SMH year–1 | 1000 | 1000 | 1600 | 1600 | 1600 | 1600 | 1600 |
| Interest rate | % | 4 | 4 | 4 | 4 | 4 | 4 | 4 |
| Depreciation | € year–1 | 525 | 3850 | 22 400 | 12 600 | 21 000 | 16 800 | 35 000 |
| Interests | € year–1 | 50 | 1507 | 8768 | 4932 | 8220 | 6576 | 13 700 |
| Insurance | € year–1 | 2500 | 2500 | 2500 | 2500 | 2500 | 2500 | 2500 |
| Fuel | € year–1 | 2700 | 4500 | 47 840 | 31 408 | 27 040 | 27 040 | 72 800 |
| Lubricant | € year–1 | 270 | 450 | 4784 | 3141 | 2704 | 2704 | 7280 |
| Repairs | € year–1 | 263 | 1925 | 11 200 | 6300 | 10 500 | 8400 | 17 500 |
| Total | € SMH–1 | 6 | 15 | 61 | 38 | 45 | 40 | 93 |
| Crew | n. | 2 | 1 | 1 | 1 | 1 | 1 | 1 |
| Labour | € SMH–1 | 32 | 16 | 20 | 20 | 20 | 20 | 20 |
| Overheads | € SMH–1 | 8 | 6 | 16 | 12 | 13 | 12 | 23 |
| Total rate | € SMH–1 | 46 | 37 | 97 | 70 | 78 | 72 | 136 |
| Table 4. Productivity by treatment and work phase. |
| Mechanization | Manual | Mechanized |
| System | type | WT | CTL | WT | CTL |
| Felling | odt SMH–1 | 0.9a | 0.6b | 18.2c | 4.9d |
| Extraction | odt SMH–1 | 2.3a | 0.6b | 13.5c | 6.9d |
| Chipping | odt SMH–1 | 18.7a | 16.7a | 15.5a | 17.5a |
| Extraction distance | m | 233a | 140a | 189a | 174a |
| Load size | odt | 0.410a | 0.212b | 0.958c | 3.845d |
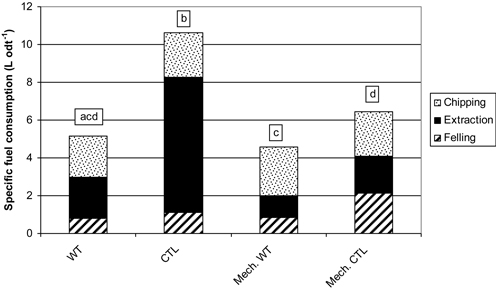
Fig. 2. Specific fuel consumption per unit product by treatment and work phase. Notes: Different letters over different bars indicate that the difference between the mean fuel consumption values are statistically significant at the 5% level according to Scheffe’s multiple comparison test; WT = motor-manual whole-tree harvesting; CTL = motor-manual cut-to-length harvesting; Mech. WT = mechanized whole-tree harvesting; Mech CTL = mechanized cut-to-length harvesting; Felling also includes delimbing and crosscutting in the case of CTL harvesting operations.
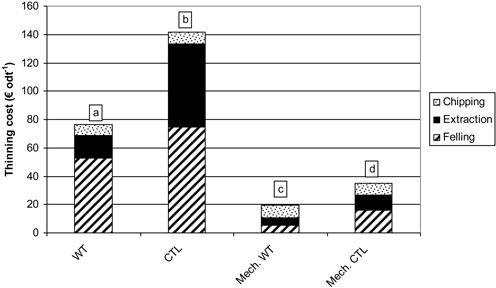
Fig. 3. Thinning cost by treatment and work phase. Notes: Different letters over different bars indicate that the difference between the mean total cost values are statistically significant at the 5% level according to Scheffe’s multiple comparison test; WT = motor-manual whole-tree harvesting; CTL = motor-manual cut-to-length harvesting; Mech. WT = mechanized whole-tree harvesting; Mech CTL = mechanized cut-to-length harvesting; Felling also includes delimbing and crosscutting in the case of CTL harvesting operations.
| Table 5. Anova table for the effect of mechanization level and harvesting system on unit cost and fuel consumption. |
| Thinning cost (€ odt–1) |
| Effect | DF | SS | η2 | F-Value | P-Value |
| Mechanization | 1 | 20003 | 0.71 | 113.034 | <0.0001 |
| System | 1 | 4863 | 0.17 | 27.479 | 0.0008 |
| Interaction | 1 | 1861 | 0.07 | 10.515 | 0.0118 |
| Residual | 8 | 1416 | 0.05 | | |
| Specific fuel consumption (L odt–1) |
| Effect | DF | SS | η2 | F-Value | P-Value |
| Mechanization | 1 | 17.452 | 0.22 | 13.529 | 0.0062 |
| System | 1 | 40.853 | 0.52 | 31.668 | 0.0005 |
| Interaction | 1 | 10.155 | 0.13 | 7.872 | 0.0230 |
| Residual | 8 | 10.32 | 0.13 | | |
| Table 6. Site impact for the four treatments on test. |
| Mechanization | Manual | Mechanized |
| System | type | WT | CTL | WT | CTL |
| Wounding | % trees | 6.0a | 15.7 | 2.5ab | 1.5b |
| Wound size | cm2 | 433a | 407a | 106a | 431a |
| Soil density untrafficked | g cm–3 | 1.30a | 1.18a | 1.25a | 1.21a |
| Soil density trafficked | g cm–3 | 1.28a | 1.28a | 1.28a | 1.36a |
| Difference | % | –1.2 | 8.8 | 2.5 | 11.9 |
| t test | p-value | 0.3462 | <0.0001 | 0.2332 | <0.0001 |