| Table 1. Characteristics of the Scots pine field trials in Sweden and Russia. | |||||||||
| Country | Name | Latitude, longitude | Altitude (m a.s.l.) | Continentality index | Area (ha) | Plot size | Spacing (m) | No. of seedlings | |
| 2007a | Normalb | ||||||||
| Sweden | Bäcksjön | 63°56´N, 20°21´E | 75 | 25.5 | 18.6 | 1.3 | 1×1 | 2.2×2 | 2785 |
| Russia | Syktyvkar | 61°40´N, 51°03´E | 132 | 38.5 | 31.9 | 1.1 | 1×1 | 2×2 | 2128 |
| a Continentality index calculated per Lockwood (1985). b Average over 10-year period 1998–2007 from SMHI (2018) at Bäcksjön and Novakovskiy and Elsakov (2014) at Syktyvkar. | |||||||||
| Table 2. Geographic origin of the populations studied. | ||
| Provenance designation | Latitude, longitude | Altitude (m a.s.l.) |
| Populations from Sweden | ||
| Almajärvi | 68°02´N, 23°08´E | 320 |
| Lainio | 67°40´N, 22°22´E | 350 |
| Tärendö | 67°05´N, 22°40´E | 250 |
| Harads | 66°10´N, 18°54´E | 200 |
| Arvidsjaur | 65°35´N, 19°40´E | 400 |
| Skellefteå | 65°00´N, 20°30´E | 150 |
| Ramsele | 63°30´N, 16°25´E | 400 |
| Sollefteå | 63°00´N, 17°00´E | 200 |
| Stöde | 62°25´N, 16°37´E | 200 |
| Ånge | 62°15´N, 15°55´E | 300 |
| Edsbyn | 61°30´N, 15°30´E | 400 |
| Malung | 60°30´N, 13°45´E | 450 |
| Populations from Russia | ||
| Ertom | 63°33´N, 47°50´E | 130 |
| Ertom | 63°31´N, 47°45´E | 130 |
| Mitrofanovo | 63°12´N, 56°03´E | 140 |
| Kyltovo | 62°12´N, 51°00´E | 160 |
| Komsomolsk | 62°07´N, 56°36´E | 170 |
| Ust-Kulom | 61°41´N, 53°40´E | 190 |
| Vilgort | 61°39´N, 50°46´E | 120 |
| Sherjg | 61°36´N, 54°19´E | 110 |
| Kuratovo | 60°55´N, 49°30´E | 180 |
| Koygorodok | 60°27´N, 51°00´E | 150 |
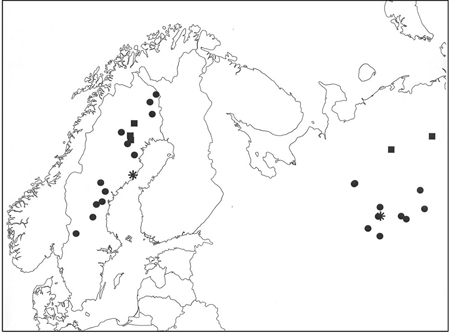
Fig. 1. Location of the Scots pine populations (●), stands with selected plus trees (■) and field trials (*).
| Table 3. Geographic origin of the open-pollinated families studied. | |||
| Stand designation | Number of OP families | Latitude, longitude | Altitude (m a.s.l.) |
| Half-sib families from Sweden | |||
| Ranesvare | 6 | 66°37´N, 20°27´E | 200 |
| Moskosel | 7 | 66°00´N, 19°59´E | 290 |
| Arvidsjaur | 6 | 65°46´N, 20°03´E | 375 |
| Half-sib families from Russia | |||
| Ust-Chilma | 11 | 65°23´N, 52°21´E | 50 |
| Usinsk | 9 | 66°05´N, 57°30´E | 75 |
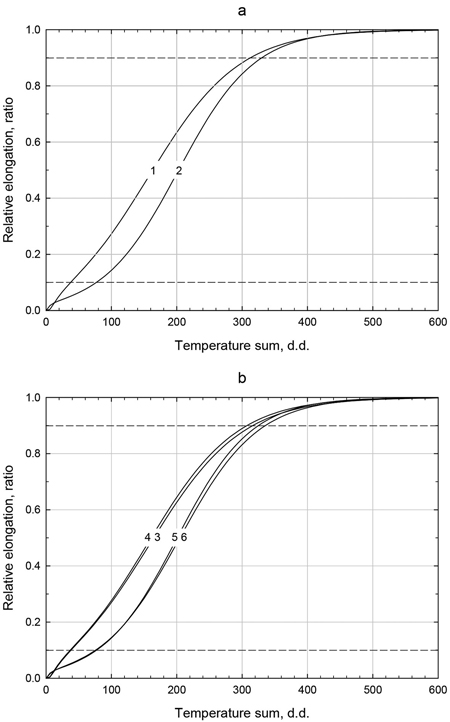
Fig. 2. Relationships between heat sum and relative shoot elongation estimated from the sigmoid function y = 1/(1 + be(rx+c/x)) based on: (a) populations at (1) Bäcksjön and (2) Syktyvkar test sites; and (b) Swedish (3, 5) and Russian (4, 6) material in Bäcksjön (3, 4) and Syktyvkar (5, 6) field trials, respectively.
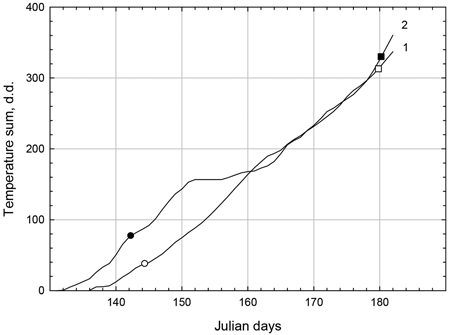
Fig. 3. Temperature sum accumulation over Julian days for populations at Bäcksjön (1) and Syktyvkar (2) test sites. The temperature sum at 10% (○, ●) and 90% (□, ■) estimated shoot elongation is indicated by symbols in Bäcksjön (○, □) and Syktyvkar (●, ■) field trials, respectively.
| Table 4. Selected date and corresponding actual mean shoot elongation representing growth onset and cessation. | ||||||
| Onset | Cessation | |||||
| Field trial | Date | Degree days | (%) | Date | Degree days | (%) |
| Syktyvkar | May 20 | 50.4 | 8.7 | July 1 | 360.4 | 93.1 |
| Bäcksjön | May 24 | 36.6 | 11.1 | June 27 | 296.3 | 88.2 |
| Table 5. Onset of growth, parameter estimates from Model 1 with p-values. | ||||
| Source | Parameter | Estimate | Standard error | p-value |
| Site | s | –0.02363a | 0.00559 | <0.0001 |
| Region of origin | r | 0.02013 | 0.00613 | 0.0012 |
| Regression coefficient for latitude | d | 0.00728 | 0.00131 | <0.0001 |
| a differences between Russian and Swedish test sites include dates of measurement and other site-specific environmental effects. | ||||
| Table 6. Cessation of growth, parameter estimates from Model 1 with p-values. | ||||
| Source | Parameter | Estimate | Standard error | p-value |
| Site | s | 0.04869a | 0.008523 | <0.0001 |
| Region of origin | r | 0.02685 | 0.00937 | 0.0045 |
| Regression coefficient for latitude | d | 0.00932 | 0.00199 | <0.0001 |
| a differences between Russian and Swedish test sites include dates of measurement and other site-specific environmental effects. | ||||
| Table 7. Narrow-sense heritabilities (h2 ± S.E.) of Scots pine phenological traits. | ||||
| Model 2 | Model 3 | |||
| Field trial | Onset | Cessation | Onset | Cessation |
| Syktyvkar (Russia) | Not estimable | 0.021 ± 0.052 | 0.084 ± 0.251 | Not estimable |
| Bäcksjön (Sweden) | Not estimable | 0.061 ± 0.151 | 0.482 ± 0.181 | 0.501 ± 0.165 |