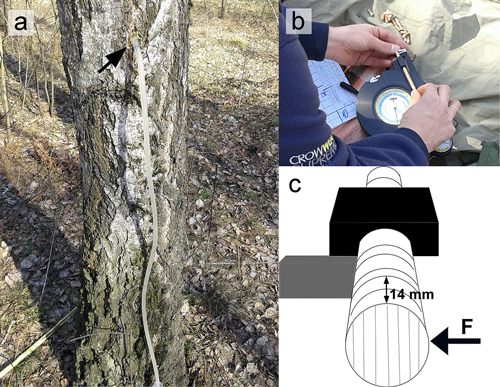
Fig. 1. Illustration of the birch sap exudation experiment. (a) Tree-trunk from the edge of the forest stand during sap exudation. (b) Mechanical tests using a fractometer. (c) Scheme of a bending strength measurement in a fractometer, consecutive 14 mm fragments of the core are broken across the fibres.
| Table 1. Daily temperature within the test period. | |||
| Temperature [°C] | |||
| Date | Avg. | Max. | Min. |
| March 21 | 13 | 22 | 4 |
| March 28 | 11 | 17 | 6 |
| April 4 | 7 | 12 | 2 |
| April 11 | 6 | 11 | 1 |
| April 18 | 6 | 9 | 3 |
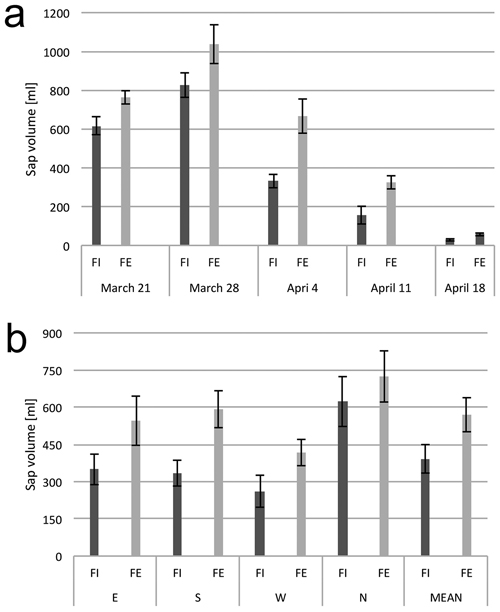
Fig. 2. Xylem sap flow from birch trunks. (a) Dynamics of sap flow from tree trunks from the interior (FI) and from the edge (FE) of the forest stand, at consecutive dates in the early spring. (b) Xylem sap flow from birch trunks from the interior (FI) and from the edge (FE) of the forest stand from the samples collected from four sides around the stem circumference (N, E, S and W). The means from 6 trees for (a) and from 30 trees sampled during the study period from March 21 to April 18 (b). Standard errors of means are indicated.
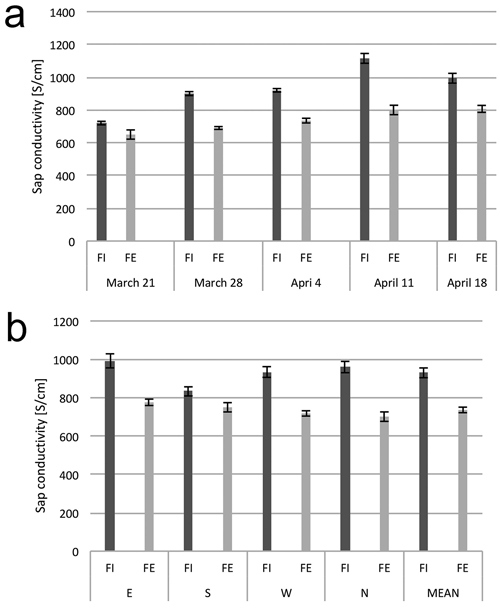
Fig. 3. Electrolytic conductivity of xylem sap. (a) Dynamics of electrolytic conductivity of the sap from birch trunks from the interior (FI) and from the edge (FE) of the forest stand, at consecutive dates in early spring. (b) Electrolytic conductivity of sap from birch trunks from the interior (FI) and from the edge (FE) of the forest stand from the samples collected from four sides around stem circumference (N, E, S and W). The means from 6 trees for (a) and from 30 trees sampled during the study period from March 21 to April 18 (b). Standard errors of means are indicated.
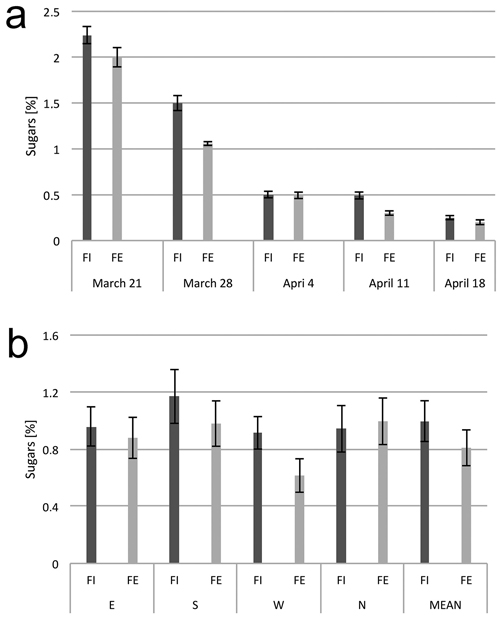
Fig. 4. Sugar content in the xylem sap. (a) Dynamics of sugar content in the sap from birch trunks from the interior (FI) and from the edge (FE) of the forest stand, at consecutive dates in the early spring. (b) Sugar content in the xylem sap from birch trunks from the interior (FI) and from the edge (FE) of the forest stand from the samples collected from four sides around the stem circumference (N, E, S and W). The means from 6 trees for (a) and from 30 trees sampled during the study period from March 21 to April 18 (b). Standard errors of means are indicated.
| Table 2. Results of the three-factor mixed model ANOVA for testing differences between the means of xylem sap characteristics. ANOVA F and p values are shown for three tests performed separately for each of the three xylem sap parameters: volume, electrolytic conductivity and sugar content. | |||
| Type of effect | Source of variable | Xylem sap characteristics | ANOVA estimates F, p |
| Main within-subjects | Sample position on tree stem E vs S vs W vs N | Volume | F (3, 50) = 61.93; p < 0.001 |
| Conductivity | F (3, 50) = 15.26; p < 0.001 | ||
| Sugars | F (3, 50) = 25.83; p < 0.001 | ||
| Main inter-subjects | Date of sample collection 21.03 vs 28.03 vs 04.04 vs 11.04 vs 18.4 | Volume | F (4, 50) = 86.95; p < 0.001 |
| Conductivity | F (4, 50) = 48.12; p < 0.001 | ||
| Sugars | F (4, 50) = 386.39; p < 0.001 | ||
| Main inter-subjects | Location of tree in forest (FE vs FI) | Volume | F (1, 50) = 27.65; p < 0.001 |
| Conductivity | F (1, 50) = 207.42; p < 0.001 | ||
| Sugars | F (1, 50) = 26.89; p < 0.001 | ||
| Interaction | Date of sample collection × location of tree in forest | Volume | F (4, 50) = 2.15; p = 0.088 |
| Conductivity | F (4, 50) = 8.43; p < 0.001 | ||
| Sugars | F (4, 50) = 4.57; p = 0.003 | ||
| Interaction | Sample position on tree stem × date of sample collection | Volume | F (12, 50) = 42.19; p < 0.001 |
| Conductivity | F (12, 50) = 4.50; p < 0.001 | ||
| Sugars | F (12, 50) = 13.08; p < 0.001 | ||
| Interaction | Sample position on tree stem × location of tree in forest | Volume | F (3, 50) = 3.46; p = 0.018 |
| Conductivity | F (3, 50) = 15.18; p < 0.001 | ||
| Sugars | F (3, 50) = 12.25; p < 0.001 | ||
| Table 3. Pearson-r correlation coefficients between xylem sap characteristics: volume, conductivity and sugar content in four sample positions (E, S, W, N) around stem circumference; * p < 0.050, **p < 0.001. | ||||||||||||||||
| XYLEM SAP VOLUME | XYLEM SAP CONDUCTIVITY | XYLEM SAP SUGARS | ||||||||||||||
| E | S | W | N | Mean | E | S | W | N | Mean | E | S | W | N | Mean | ||
| XYLEM SAP VOLUME | E | |||||||||||||||
| S | 0.29* | |||||||||||||||
| W | 0.74** | 0.49** | ||||||||||||||
| N | 0.65** | 0.64** | 0.58** | |||||||||||||
| Mean | 0.82** | 0.72** | 0.83** | 0.90** | ||||||||||||
| XYLEM SAP CONDUCTIVITY | E | –0.55** | –0.53** | –0.53** | –0.68** | –0.70** | ||||||||||
| S | –0.49** | –0.39* | –0.24 | –0.55** | –0.53** | 0.59** | ||||||||||
| W | –0.34* | –0.27* | –0.20 | –0.34* | –0.36* | 0.72** | 0.58** | |||||||||
| N | –0.41* | –0.34* | –0.26* | –0.36* | –0.42** | 0.74** | 0.55** | 0.79** | ||||||||
| Mean | –0.52** | –0.44** | –0.37* | –0.56** | –0.58** | 0.89** | 0.76** | 0.89** | 0.91** | |||||||
| XYLEM SAP SUGARS | E | 0.67** | 0.32* | 0.42** | 0.70** | 0.67** | –0.58** | –0.49** | –0.32* | –0.35* | –0.50** | |||||
| S | 0.65** | 0.14 | 0.30* | 0.67** | 0.57** | –0.53** | –0.46** | –0.32* | –0.38* | –0.49** | 0.94** | |||||
| W | 0.41* | 0.06 | 0.25* | 0.52** | 0.41* | –0.23 | –0.18 | 0.08 | 0.07 | –0.07 | 0.73** | 0.71** | ||||
| N | 0.60** | 0.18 | 0.25 | 0.66** | 0.56** | –0.58** | –0.55** | –0.40* | –0.49** | –0.58** | 0.85** | 0.89** | 0.53** | |||
| Mean | 0.65** | 0.20 | 0.33* | 0.70** | 0.61** | –0.54** | –0.48** | –0.29* | –0.34* | –0.48** | 0.97** | 0.98** | 0.78** | 0.92* | ||
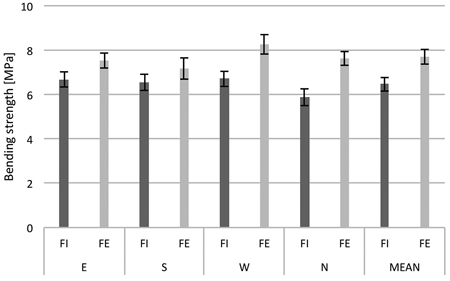
Fig. 5. Bending strength of birch trunk wood from the interior (FI) and from the edge (FE) of the forest stand; samples from four sides around the stem circumference (N, E, S and W). The means from 30 trees sampled during the study period (March 21 to April 18). Standard errors of means are indicated.
| Table 4. Results of the two-factor mixed model ANOVA for testing differences between the means of xylem structure characteristics. ANOVA F and p values are shown for four tests performed separately for each of the four xylem structure parameters: bending strength, average vessel lumen area, vessel number per 1 mm2 of wood cross-section and potential conductivity index (PCI). | |||
| Type of effect | Source of variable | Wood characteristics | NOVA estimates F, p |
| Main effect of within-subjects factors | Sample position on tree stem (E vs S vs W vs N) | Bending strength | F (3, 58) = 3.70; p = 0.013 |
| Vessel area | F (3, 10) = 0.22; p = 0.884 | ||
| Vessel number | F (3, 10) = 57.20; p < 0.001 | ||
| PCI | F (3, 10) = 6.20; p = 0.002 | ||
| Main effect of between subjects factors | Location of tree in forest (FE vs FI) | Bending strength | F (1, 58) = 7.18; p = 0.010 |
| Vessel area | F (1, 10) = 0.52; p = 0.487 | ||
| Vessel number | F (1, 10) = 33.36; p < 0.001 | ||
| PCI | F (1, 10) = 0.21; p = 0.654 | ||
| Interaction | Sample position on tree stem × location of tree in forest | Bending strength | F (3, 58) = 2.59; p = 0.054 |
| Vessel area | F (3, 10) = 0.06; p = 0.979 | ||
| Vessel number | F (3, 10) = 24.18; p < 0.001 | ||
| PCI | F (3, 10) = 1.14; p = 0.350 | ||
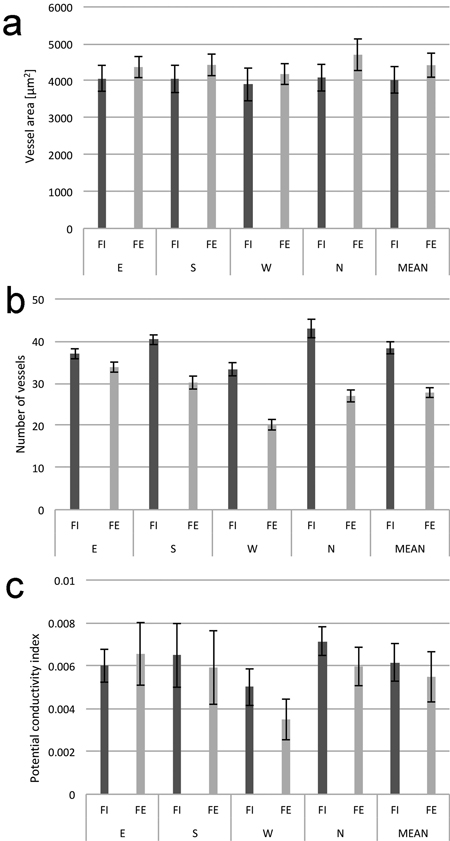
Fig. 6. Average vessel lumen area (a), number of vessels (b), and potential conductivity index (c) calculated for 1 mm2 of cross-sections area of wood in birch trunks from the interior (FI) and from the edge (FE) of the forest stand; samples from four sides around stem circumference (N, E, S and W). The means from 6 trees felled in October. Standard errors of means are indicated.