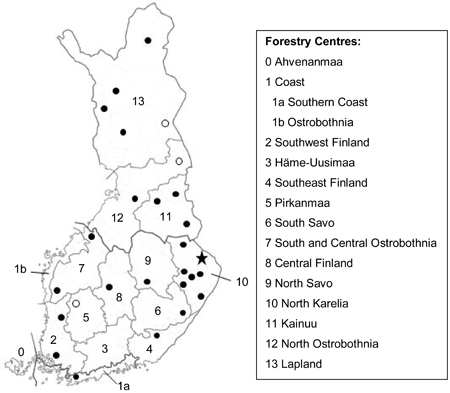
Fig. 1. Locations of MASI stands used in this study. Black circle means that there was one stand per municipality. The cases with two stands and five stands per municipality are marked with an unfilled circle and a star, respectively. Numbers 0–13 refer to Forestry Centres of Finland.
| Table 1. Main characteristics of cowberry coverage and stands in the PSP3000 data used in this study, by categories (a)–(g). Categories (a)–(e) pertain to forest land. For each category, number of stands (N), mean values and ranges of variation (min–max) of the characteristics are presented. Sites I-V and VII-VIII refer to different site quality classes (I = herb-rich forests, eutrophic mires, II = herb-rich heath forests, mesotrophic mires, III = mesic heath forests, meso-oligotrophic mires, IV = sub-xeric heath forests, oligotrophic mires, V = xeric heath forests, poor ombro-oligotrophic bogs, VII = rocky and sandy soils, VIII = summit and fell forests). View in new window/tab. |
| Table 2. Main characteristics of cowberry and stands in the MASI data (193 annual observations in 34 stands). Sites III-V refer to different site quality classes of mineral soil forests (III = mesic heath forest, IV = sub-xeric heath forest, V = xeric heath forest). | ||||
| Characteristic | N | Mean | Min | Max |
| Number of berries (m–2) | 193 | 130.4 | 0 | 2338 |
| on site III | 15 | 233.8 | 11 | 1173 |
| on site IV | 154 | 122.4 | 0 | 2338 |
| on site V | 24 | 117.1 | 8 | 332 |
| Coverage of cowberry (%) | 34 | 48.2 | 9 | 86 |
| on site III | 3 | 63.0 | 52 | 77 |
| on site IV | 26 | 46.2 | 9 | 86 |
| on site V | 5 | 49.4 | 22 | 76 |
| Altitude (m) | 34 | 149.2 | 19 | 314 |
| Temperature sum (dd) | 34 | 1015.5 | 682 | 1337 |
| Stand age (a) | 34 | 75.7 | 5 | 300 |
| Stand basal area (m2ha–1) | 34 | 12.0 | 0 | 35 |
| Table 3. The multi-level binomial model (Model 1) estimated for the mean percentage coverage of cowberry on the 2-m2 quadrates in the stands of the PSP3000 data. Sites I-V and VII-VIII refer to different site quality classes (see Table 1). Mineral soils, spruce mires and pine mires pertain to forest land (i.e. categories a-e of this study). | |||||
| Variable | Estimate | Std error | t-value | Odds ratio | p-value |
| Intercept | –4.7902 | 0.4571 | –10.48 | 0.008 | <0.001 |
| Site (ref. IV, mineral soils) a) | |||||
| site I, mineral soils | –5.1730 | 0.2410 | –21.47 | 0.006 | <0.001 |
| site II, mineral soils | –2.5690 | 0.1396 | –18.40 | 0.077 | <0.001 |
| site III, mineral soils | –0.4216 | 0.0687 | –6.13 | 0.656 | <0.001 |
| site V, mineral soils | –0.4185 | 0.1403 | –2.98 | 0.658 | 0.003 |
| sites I-II, spruce mires | –2.0679 | 0.1567 | –13.20 | 0.126 | <0.001 |
| site III, spruce mires | –0.7984 | 0.1179 | –6.77 | 0.450 | <0.001 |
| sites I-III, pine mires | –1.8198 | 0.1543 | –11.79 | 0.162 | <0.001 |
| site IV, pine mires | –0.5644 | 0.0959 | –5.88 | 0.569 | <0.001 |
| site V, pine mires | –1.7620 | 0.1121 | –15.72 | 0.172 | <0.001 |
| site VIII, poorly productive land | –1.4831 | 0.2776 | –5.34 | 0.227 | <0.001 |
| site VIII, waste land | –2.9819 | 0.333 | –8.95 | 0.051 | <0.001 |
| FormerAgrLand b), mineral soils | –0.9438 | 0.1993 | –4.73 | 0.389 | <0.001 |
| Spruce c) on sites I-III, mineral soils and spruce mires | –0.4327 | 0.0663 | –6.52 | 0.649 | <0.001 |
| Deciduous trees c) on sites I-III, mineral soils and spruce mires | –0.7528 | 0.1009 | –7.46 | 0.471 | <0.001 |
| 1000/Temperature sum (dd) | 2.5592 | 0.5561 | 4.60 | 12.925 | <0.001 |
| Altitude (m) | –0.0039 | 0.0008 | –4.62 | 0.996 | <0.001 |
| Stand age (a) on sites I-II, mineral soils | 0.0106 | 0.0019 | 5.65 | 1.011 | <0.001 |
| Stand basal area (m2ha–1), forest land d) | 0.0157 | 0.0025 | 6.19 | 1.016 | <0.001 |
| Variance components at e) | |||||
| forestry centre region level | 0.1211 | (14) | |||
| municipality level | 0.1839 | (367) | |||
| cluster level | 0.1819 | (983) | |||
| sample plot level | 0.2148 | (2515) | |||
| stand level (“pseudo” level) | 0.9463 | (2801) | |||
| a) The parameter estimates of site variables “site VII, mineral soils” and “site IV, spruce mires” were not statistically significant. b) FormerAgrLand (former agricultural land) is an indicator variable for stand history (ref. forest). c) An indicator variable for the dominant tree species (the reference is other tree species). d) In this context, forest land refers to categories (a)–(e) of this study. e) The number of observations at each level is given in parentheses. A random term at “pseudo” level accounts for the overdispersion. | |||||
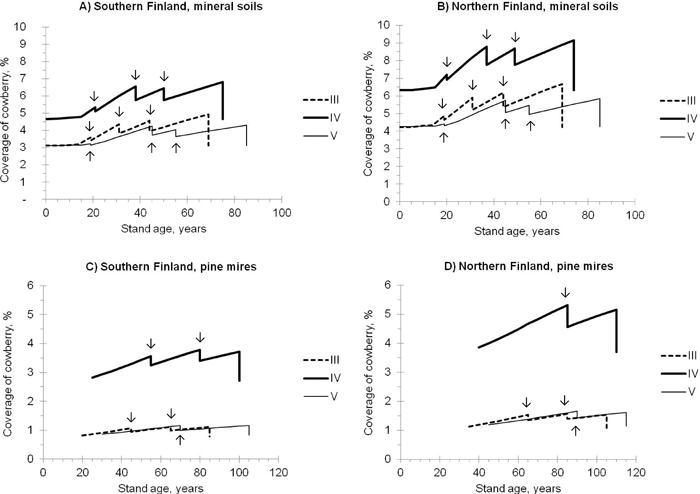
Fig. 2. Predicted coverage of cowberry in pine stands of different site fertilities (i.e. sites III-V; see the definitions in Table 1). The development of stands, representing mineral soils (A, B) and pine mires (C, D) in southern (A, C) and northern (B, D) Finland, was simulated using the Motti simulator (arrows indicate thinnings). Predictions were calculated using Model 1 (Table 3).
| Table 4. The multi-level Poisson model (Model 2) estimated for the mean number of cowberries on five 1-m2 quadrates in pine-dominated stands of the MASI data, measured in 2001–2012. Sites III-V refer to different site quality classes of mineral soil forests (see Table 2). | ||||
| Variable | Estimate | Std error | t-value | p-value |
| Intercept | 6.5404 | 1.0099 | 6.48 | <0.001 |
| Year effect (ref. 2012) | ||||
| 2001 | 0.6276 | 0.3083 | 2.04 | 0.044 |
| 2002 | 0.1742 | 0.3011 | 0.58 | 0.564 |
| 2003 | 0.3927 | 0.3118 | 1.26 | 0.210 |
| 2004 | 0.1290 | 0.2941 | 0.44 | 0.662 |
| 2005 | 1.0525 | 0.2960 | 3.56 | 0.001 |
| 2006 | 0.4146 | 0.2919 | 1.42 | 0.158 |
| 2007 | 0.1529 | 0.2700 | 0.57 | 0.572 |
| 2008 | –0.2921 | 0.2682 | –1.09 | 0.278 |
| 2009 | –0.3474 | 0.2710 | –1.28 | 0.202 |
| 2010 | –0.2773 | 0.2698 | –1.03 | 0.306 |
| 2011 | 0.1925 | 0.2714 | 0.71 | 0.479 |
| Coverage of cowberry (%) | 0.0966 | 0.0208 | 4.64 | 0.010 |
| Coverage of cowberry2/100 (%) | –0.0837 | 0.0217 | –3.86 | 0.018 |
| Ln (Stand basal area + 1) (m2ha–1) | –0.4716 | 0.0993 | –4.75 | 0.009 |
| Altitude (m) | 0.0071 | 0.0023 | 3.06 | 0.009 |
| 1000/Temperature sum (dd) | –4.6264 | 1.0758 | –4.30 | 0.001 |
| Variance components at a) | ||||
| forestry centre region level | 0.2270 | (12) | ||
| municipality level | 0.0904 | (27) | ||
| stand level | <0.0001 | (34) | ||
| stand x year level (“pseudo” level) | 0.5024 | (193) | ||
| a) The number of observations at each level is given in parentheses. A random term at “pseudo” level accounts for the overdispersion. | ||||
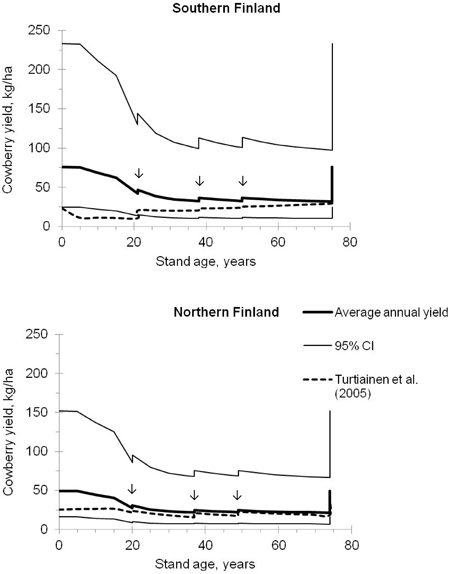
Fig. 3. Predicted average annual yields of cowberry and their 95% confidence intervals in pine stands on site IV (i.e. sub-xeric heath forest) in southern and northern Finland. The development of stands was simulated using the Motti simulator (arrows indicate thinnings). Predictions were calculated using Models 1 and 2 (Tables 3 and 4), and were also compared with the estimates computed using the models of Turtiainen et al. (2005).