| Table 1. Stand characteristics at the time of establishment (in first measurement) and at the beginning of the last growth period. | ||||
| First measurement | Last measurement | |||
| Mean, (std) | Range, min–max | Mean, (std) | Range, min–max | |
| N, ha | 1819 (1101) | 174–11426 | 1624 (855) | 315–7474 |
| G, m2 ha–1 | 13.7 (7.6) | 0.6–34.9 | 16.6 (7.4) | 1.3–40.0 |
| D, cm | 12.4 (4.1) | 4.3–31.7 | 14.4 (3.9) | 6.5–26.9 |
| Hdom, m | 10.8 (3.9) | 2.8–24.8 | 12.5 (3.9) | 3.4–24.4 |
| N = Number of stems per hectare, G = stand basal area, D = mean diameter at breast height (weighted by tree basal area), Hdom = stand dominant height (mean height of trees with diameter larger than the basal area median diameter). | ||||
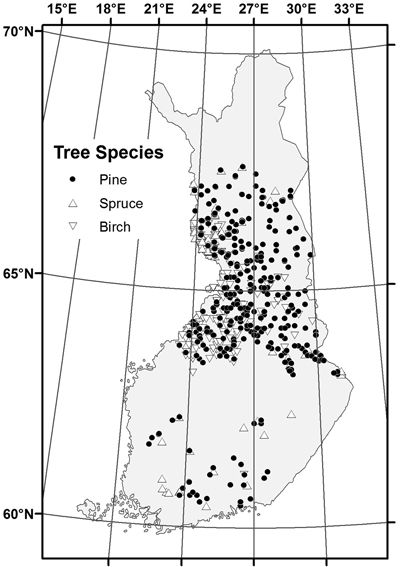
Fig. 1. Location of the sample stands by dominant tree species.
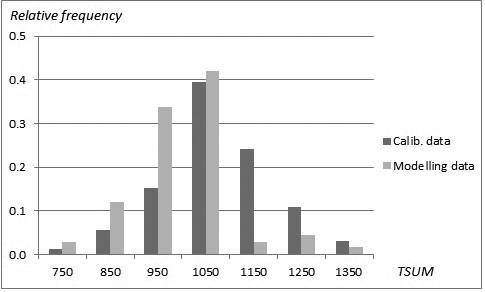
Fig. 2. Distribution (relative frequency) of stands in the modelling data (SINKA) and calibration data (NFI11) as a function of temperature sum.
| Table 2. Proportion of tree species (% of basal area) at establishment. | ||||
| Dominant tree species | Number of stands | Pine %, | Spruce % | Birch % |
| Scots pine | 383 | 82.7 (17.8–100) | 4.0 (0–45.2) | 13.0 (0–75.1) |
| Norway spruce | 63 | 7.4 (0–97.0) | 65.0 (1.0–100) | 26.1 (0–75.4) |
| Birch | 155 | 11.6 (0–58.7) | 6.8 (0–39.5) | 79.7 (20.9–100) |
| Table 3. Mean and range of the sample tree characteristics by tree species. | ||||||
| Variable | Scots pine | Norway spruce | Birch | |||
| Mean | Range | Mean | Range | Mean | Range | |
| Diameter, cm | 11.8 | 1.6–39.0 | 12.9 | 0.6–48.7 | 10.6 | 2.0–33.7 |
| Height, m | 8.7 | 1.6–27.8 | 9.6 | 1.5–28.2 | 10.1 | 2.3–23.5 |
| Diameter growth 1, mm | 13 | 0–81 | 13 | 0–68 | 10 | 0–63 |
| Height growth 2, dm | 10.4 | 0–66 | 10.4 | 0–50 | 9.6 | 0–72 |
| Pine 3, % | 85.3 | 1.0–100 | 13.0 | (0–99) | 21.9 | 0–99.4 |
| Spruce 3, % | 3.6 | 0–92.7 | 56.2 | 2.9–100 | 10.7 | (0–97.7) |
| Birch 3, % | 10.9 | 0–99.0 | 21.9 | 0–99.4 | 66.2 | 0.6–100 |
| 1 Diameter growth at breast height during five years period, 2 height growth during the five years period, 3 proportion (%) of basal area (m2). | ||||||
| Table 4. Distribution of study stands by drained peatland site types. | |||||
| Number of stands, N | Dominant tree species, N * | ||||
| Scots pine | Norway spruce | Birch | |||
| Rhtkg I | 74 | 8 | 17 | 49 | |
| Rhtkg II | 57 | 9 | 14 | 34 | |
| Mtkg I | 50 | 13 | 21 | 16 | |
| Mtkg II | 128 | 99 | 3 | 26 | |
| Ptkg I | 157 | 137 | 8 | 12 | |
| Ptkg II | 114 | 96 | - | 18 | |
| Vatkg | 21 | 21 | - | - | |
| Total | 601 | 383 | 63 | 155 | |
| * Number of stands. | |||||
| Table 5. Tree variables in 11th National Forest Inventory data (NFI11). | ||||||
| Variable | Scots pine | Norway spruce | Birch | |||
| Mean | Range | Mean | Range | Mean | Range | |
| Diameter, cm | 17.1 | 1.0–47.0 | 17.5 | 1.1–50.2 | 13.1 | 0.6–41.3 |
| Height, m | 13.1 | 1.6–30.4 | 14.0 | 1.7–31.3 | 12.8 | 2.0–31.0 |
| Diameter growth 1, mm | 11 | 0–66 | 17 | 0–85 | 11 | 0–65 |
| Height growth 2, dm | 12.7 | 0–34 | 15.3 | 0–43 | 10.7 | 0.33 |
| 1 Diameter growth at breast height during five years period, 2 height growth during the five years period. | ||||||
| Table 6. Parameter estimates of models for diameter (id5, mm) growth of pine, spruce and birch. Standard error of the estimates is presented in parenthesis. | |||
| Pine ln(id5 + 2), mm | Spruce ln(id5 + 4), mm | Birch ln(id5 + 4), mm | |
| Variable | Estimate | Estimate | Estimate |
| Intercept | 3.035 (0.010) | 2.250 (0.139) | –7.332 (1.341) |
| d | 0.046 (0.004) | ||
| ln(d) | 0.987 (0.043) | 0.666 (0.041) | |
| d1.5 | –0.0011 (0.000) | ||
| d2 | –0.00071 (0.000) | ||
| ln(BA) | –0.271 (0.018) | –0.132 (0.024) | –0.172 (0.017) |
| BAL | –0.011 (0.003) | ||
| BAL2 | –0.00028 (0.000) | ||
| BALspruce | –0.022 (0.002) | ||
| BALdeciduous | –0.022 (0.001) | ||
| Hdom | –0.074 (0.004) | ||
| ln(Hdom) | –0.680 (0.054) | ||
| d/Hdom | –0.658 (0.034) | –0.564 (0.050) | |
| (d/Hdom)2 | –0.115 (0.015) | ||
| 1 – exp(–1 × (TS/1000)4) | 0.949 (0.092) | 1.228 (0.184) | |
| ln(TS) | 1.471 (0.193) | ||
| ALT | 0.00076 (0.000) | 0.0013 (0.0002) | |
| DR0-5 × TS≥1000 | 0.271 (0.043) | ||
| DR0-10 | 0.148 (0.024) | ||
| DR11-15 | 0.081 (0.015) | ||
| DR5-15 | 0.106 (0.012) | ||
| DR>20 | –0.075 (0.010) | –0.037 (0.011) | |
| DR>25 | –0.060 (0.017) | ||
| DNM0-5 | 0.052 (0.013) | ||
| DNM × TS<1050 | 0.092 (0.028) | ||
| DNMTS>800 × (Mtkg II, Ptkg) | 0.070 (0.019) | ||
| NDNM | –0.297 (0.036) | ||
| NDNM × ln(BA) | 0.090 (0.014) | ||
| THIN0-5 | 0.033 (0.012) | ||
| THIN6-10 | 0.044 (0.017) | ||
| Unthinned | –0.085 (0.022) | ||
| Rhtkg | 0.064 (0.027) | ||
| Rhtkg, Mtkg I × ln(d) | –0.076 (0.032) | ||
| Mtkg II, Ptkg × ln(d) | –0.112 (0.030) | ||
| Ptkg Ipoor × ln(d) | –0.024 (0.010) | ||
| Mtkg × Hdom | –0.0088 (0.004) | ||
| Ptkg × Hdom | –0.011 (0.004) | ||
| Vatkg × Hdom | –0.056 (0.008) | –0.049 (0.020) | |
| RIMPI | –0.442 (0.152) | ||
| PK<20 × (Mtkg II, Ptkg II) | 0.057 (0.018) | ||
| PK<25 × (Mtkg II, Ptkg II) | 0.239 (0.043) | ||
| var(ui) | 0.055 | 0.054 | 0.038 |
| var(vij) | 0.026 | 0.021 | 0.014 |
| corr(eijkt) | 0.288 | 0.363 | 0.391 |
| var(eijk) | 0.186 | 0.122 | 0.139 |
| d, tree breast height diameter (cm); BA = basal area (m2 ha–1); BAL, basal area of trees larger than the target tree (m2); BALspruce, basal area of spruce trees larger than the target tree (m2); BALdecidious, basal area of deciduous trees larger than the target tree (m2); Hdom, height of dominant trees (m); Dg, mean diameter weighted with tree basal area (cm); TS, temperature sum with a +5 °C threshold (dd); ALT, altitude, height above sea level (m a.s.l.); DRT1-T2, dummy variable for time from the last original ditching (T1 and T2 indicate time period in years); TS≥1000, dummy variable for area with temperature sum ≥ 1000 dd, DNMT1-T2, dummy variable for time from the last ditch network maintenance (T1 and T2 indicate time period in years); DNMTS>800, dummy variable for ditch network maintenance in the location with temperature sum > 800 dd; NDNM, dummy variable referring to need for ditch network maintenance; THINT1-T2, dummy variable for time from the last thinning (T1 and T2 indicate time period in years); Unthinned, dummy variable for stands with no thinning; Rhtkg, Mtkg I, Mtkg II, Ptkg I, Ptkg II and Vatkg, dummy variable of site type; Rhtkg, dummy variable for site types Rhtkg I and II, Mtkg, dummy variable for site types Mtkg I and II, Ptkg, dummy variable for site types Ptkg I and II; Ptkg Ipoor, dummy variable for the unfertile site types of Ptkg I (PSK, PKgK, PsR, KgR, PKR); RIMPI, dummy variable for the complementary site variables indicating the occurrence of flarks; PK<T, dummy variable for PK fertilization (phosphorus, potassium) with time since the treatment < T years; var(ui) variance od random stand effect; var(vij); variance of random plot effects; corr(eijkt) autocorrelation of the successive growth periods; var(eijk) error variance. | |||
| Table 7. Parameter estimates of models for height (ih5, dm) growth of pine, spruce and birch. Standard error of the estimates is presented in parenthesis. | |||
| Pine ln(ih5), dm | Spruce ln(ih5), dm | Birch ln(ih5 + 2), dm | |
| Variable | Estimate | Estimate | Estimate |
| Intercept | 0.841 (0.088) | –1.024 (0.268) | –14.659 (1.673) |
| d1.5 | –0.0021 (0.000) | ||
| ln(d) | 0.830 (0.042) | 0.937 (0.085) | 0.679 (0.052) |
| BAL | 0.015 (0.003) | ||
| BAL2 | –0.00085 (0.000) | ||
| BALspruce | –0.034 (0.006) | ||
| ln(BALspruce) | 0.121 (0.033) | ||
| BALdeciduous1.3 | –0.0060 (0.001) | ||
| Hdom | –0.091 (0.005) | –0.079 (0.005) | |
| d/Hdom | –0.760 (0.037) | –0.666 (0.120) | –0.753 (0.059) |
| N/d | –0.00022 (0.000) | ||
| ln(N) | 0.142 (0.021) | ||
| BIRCH | 0.196 (0.059) | ||
| 1 – exp(–1 × (TS/1000)4) | 1.965 (0.142) | 3.598 (0.442) | |
| Hdom × TS/1000 | –0.102 (0.026) | ||
| ln(TS) | 2.294 (0.240) | ||
| ALT | 0.0018 (0.0003) | ||
| DR0-5 × TS<1050 | –0.177 (0.083) | ||
| DR0-5 × Rhtkg | 0.226 (0.076) | ||
| DR5-15 × Mtkg, Ptkg | 0.118 (0.024) | ||
| DNM × TS<1050 | 0.320 (0.056) | ||
| DNM0-10 × Ptkg | 0.145 (0.032) | ||
| DNMTS>800 × (MtkgII, Ptkg) | 0.257 (0.020) | ||
| DNMTS>800 × Vatkg | 0.195 (0.048) | ||
| NDNM | –0.093 (0.017) | ||
| THIN6-10 | 0.082 (0.025) | ||
| MtkgII, PtkgI × ln(d) | –0.065 (0.018) | ||
| PtkgII × ln(d) | –0.083 (0.021) | ||
| Rhtkg × Hdom | 0.063 (0.027) | ||
| Mtkg, Ptkg × Hdom | 0.054 (0.027) | ||
| Vatkg × Hdom | –0.033 (0.009) | ||
| Rhtkg × PINE | –0.421 (0.095) | ||
| Rhtkg × Dg | 0.0093 (0.003) | ||
| Mtkg × Dg | 0.0065 (0.003) | ||
| PK0-15 × Ptkg | 0.130 (0.054) | ||
| PK5-20 × Mtkg II, Ptkg II | 0.094 (0.022) | ||
| var(ui) | 0.145 | 0.133 | 0.059 |
| var(vij) | 0.037 | 0.049 | 0.016 |
| corr(eijkt) | 0.042 | –0.103 | –0.014 |
| var(eijk) | 0.296 | 0.444 | 0.208 |
| c | 1.251 | 1.183 | 1.187 |
| d, tree breast height diameter (cm); BA, basal area (m2 ha–1); BAL, basal area of trees larger than the target tree (m2); BALspruce, basal area of spruce trees larger than the target tree (m2); BALdecidious, basal area of deciduous trees larger than the target tree (m2); Hdom, height of dominant trees (m); N, stem number per hectare; Dg, mean diameter weighted with tree basal area (cm); BIRCH, birch proportion of basal area (0-1); TS, temperature sum with a +5 °C threshold (dd); ALT, altitude, height above sea level (m a.s.l.); DRT1-T2, dummy variable for time from the last original ditching (T1 and T2 indicate time period in years); TS<1050, dummy variable for area with temperature sum < 1050 dd; ); DNMT1-T2, dummy variable for time from the last ditch network maintenance (T1 and T2 indicate time period in years); TS≥1050, dummy variable for area with temperature sum ≥1050 dd; DNMTS>800, dummy variable for ditch network maintenance in the location with temperature sum > 800 dd; NDNM, dummy variable referring to need for ditch network maintenance; THINT1-T2, dummy variable for time from the last thinning (T1 and T2 indicate time period in years); Rhtkg, dummy variable for site types Rhtkg I and II; Mtkg I, Mtkg II, Ptkg I, Ptkg II and Vatkg, dummy variables for drained peatland site types; Mtkg, dummy variable for site types Mtkg I and II; Ptkg, dummy variable for site types Ptkg I and II; PINE, pine proportion of basal area (0-1); PKT1-T2, dummy variable for time from the last PK fertilization (phosphorus, potassium) (T1 and T2 indicate time period in years); var(ui) variance of random stand effect; var(vij); variance of random plot effects; corr(eijkt) autocorrelation of the successive growth periods; var(eijk) error variance; c, empirical correction term. | |||
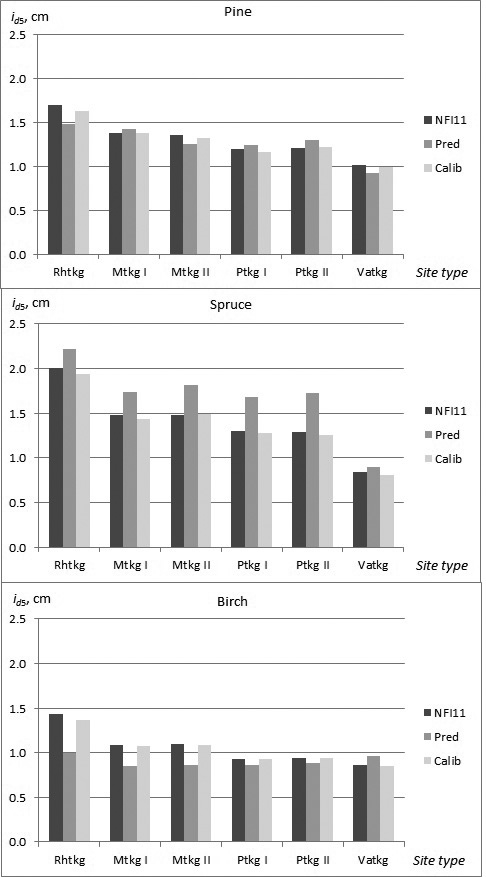
Fig. 3. Observed and predicted diameter growth of pine, spruce and birch in the calibration data (NFI11) in the different site types (NFI11; observed values, Pred; prediction obtained by the constructed model, Calib; prediction calibrated with NFI11).
| Table 8. Parameter estimates of the calibration models for diameter growth (id5, cm) of pine, spruce and birch. Standard error of the estimates is presented in parenthesis. id5Pred is predicted growth. | |||
| Pine ln((id5 + 2)/(id5Pred + 2)), cm | Spruce ln((id5 + 1)/(id5Pred + 1)), cm | Birch ln((id5 + 1)/(id5Pred + 1)), cm | |
| Variable | Estimate | Estimate | Estimate |
| Intercept | 0.044 (0.035) | 1.011 (0.096) | –0.189 (0.217) |
| TS/100 | –0.0099 (0.003) | –0.095 (0.008) | –0.027 (0.007) |
| ALT/10 | 0.0014 (0.000) | –0.010 (0.002) | –0.0052 (0.001) |
| Rhtkg | 0.051 (0.013) | 0.646 (0.206) | |
| Mtkg I-II | 0.590 (0.206) | ||
| Mtkg II | 0.044 (0.008) | ||
| Ptkg I-II | –0.084 (0.020) | 0.510 (0.206) | |
| Vatkg | 0.051 (0.006) | 0.429 (0.208) | |
| LAKE | 0.308 (0.084) | ||
| SEA | 0.241 (0.072) | 0.381 (0.147) | |
| PLANT | 0.492 (0.107) | 0.327 (0.039) | |
| PLANT × (TS/100) | –0.037 (0.010) | ||
| var(uk + eik) | 0.028 | 0.081 | 0.076 |
| ALT, altitude, height above sea level (m a.s.l.); LAKE, lake index; referring to the proportional coverage of lakes within a distance of 20 km radius; SEA, sea index; referring to the proportional coverage of sea within a distance of 20 km radius. | |||