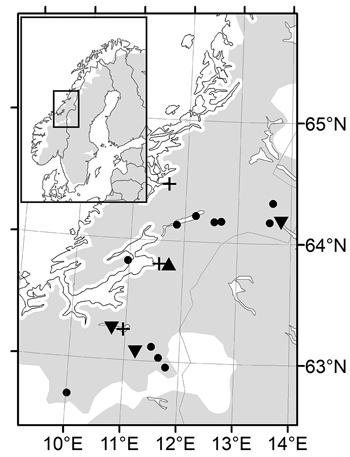
Fig. 1. Maps of the Nordic range of Norway spruce (left) and magnified Mid-Norway region with sampled populations (dots), nursery trial (triangles), short term trials (plus signs) and long term trials (turned triangles).
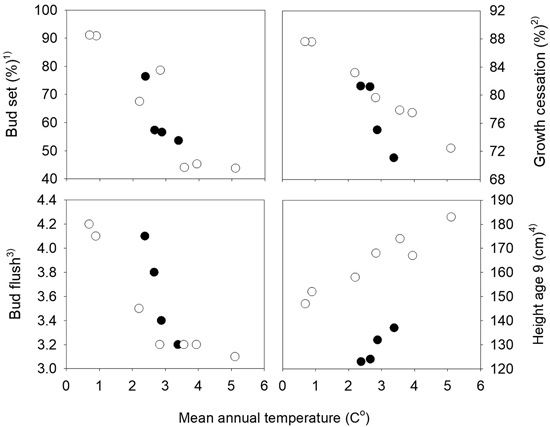
Fig. 2. Norway spruce populations from Mid-Norway. Relationships between the long-term annual mean temperatures at the population sites and population means of bud set, bud flush, growth cessation and height at age nine years. Black circles denote the southern and white circles the northern transect populations. 1) Bud set assessed in the common nursery trial at Stiklestad, 2) Growth cessation measured in the short term trials at Selbu and Stiklestad, 3) Bud flush assessed at Selbu and at Stiklestad and Kvatningen, 4) Height measured at Selbu and at Stiklestad and Kvatningen.
| Table 1. Norway spruce populations and families from Mid-Norway. Analyses of variance of transformed proportion of seedlings with apical bud measured in the nursery at August 23 in the nursery (Stiklestad). Shown are estimates of variance components, p-values and heritabilities at plot level (standard error in parentheses). | ||||
| Southern transect populations | Northern transect populations | |||
| Variance | p-value | Variance | p-value | |
| Populations | 0.013 | < 0.0001 | ||
| Families (populations) | 0.016 | 0.0003 | 0.015 | <0.001 |
| Blocks | 0.128 | <0.0001 | 0.032 | 0.001 |
| Populations × blocks | 0.004 | 0.028 | 0.009 | <0.0001 |
| Error | 0.037 | 0.031 | ||
| Heritability | 0.54 (0.17) | 0.53 (0.18) | ||
| Table 2. Norway spruce populations and families from Mid-Norway. Analyses of variance of traits measured in the short term trial at Selbu. Shown are estimates of variance components for random effects, p-values from the F-test and heritabilities (standard error in parentheses). | ||||||||
| Height age 9 | Bud flush 1) age 8 | Growth cessation 2) age 9 | Damage age 9 | |||||
| Variance | p-value | Variance | p-value | Variance | p-value | Variance | p-value | |
| Populations | 0.0004 | 0.0017 | 0.0009 | 0.92 | ||||
| Families (populations) | 33.68 | <0.0001 | 0.18 | <0.0001 | 0.0028 | <0.0001 | 0.008 | 0.04 |
| Blocks | 298.60 | <0.0001 | 0.0013 | <0.0001 | ||||
| Error | 1086.105 | 0.64 | 0.0233 | 0.500 | ||||
| Heritability | 0.09 (0.04) | 0.67 (0.12) | 0.32 (0.09) | 0.05 (0.03) | ||||
| 1) Scored according to Krutzsch (1973). 2) Proportion of growth accomplished at June 30. | ||||||||
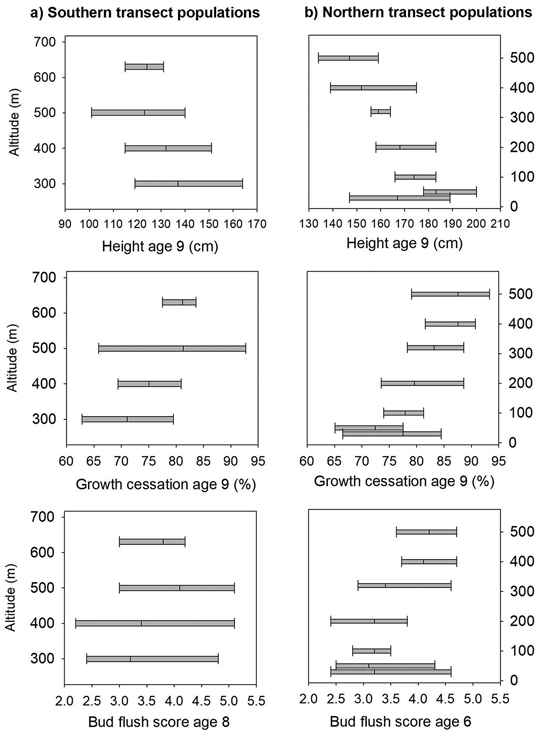
Fig. 3. Norway spruce populations and families from Mid-Norway. Means and range of variation shown for height, shoot growth cessation and bud flush score in the short term trials for the southern (a) and northern transect populations (b), ranked according to altitude.
| Table 3. Norway spruce families from Mid-Norway. Estimates of genetic correlations (with standard errors or p-values) for traits measured in the short term trial at Selbu. P-values are given when inferences are based on Pearson-correlations between BLU-predicted breeding values. | ||||
| Bud flush | Growth cessation 1) | Damage | Bud set 2) | |
| Height | 0.20 (0.23) | –0.46 (0.21) | 0.38 (p = 0.004) | –0.08 (ns) |
| Bud flush | 0.65 (0.12) | 0.18 (ns) | –0.05 (ns) | |
| Growth cessation | –0.10 (ns) | 0.03 (ns) | ||
| Damage | 0.07 (ns) | |||
| 1) Proportion of shoot growth accomplished at June 30. 2) Measured in the nursery (Stiklestad). | ||||
| Table 4. Norway spruce populations and families from Mid-Norway. Analyses of variance of traits measured in the short term trials at Stiklestad and Kvatninga. Height, bud flush, lammas shoots and damage are from measurements/assessments at both sites, while growth cessation was measured only at Stiklestad. Shown are estimates of variance components for random effects, p-values from the F-test and heritabilities (standard error in parentheses). | ||||||||||
| Height age 9 | Bud flush 1) age 6 | Growth cessation 2) age 9 | Lammas shoots age 6 3) and 9 4) | Damage age 9 | ||||||
| Variance | p-value | Variance | p-value | Variance | p-value | Variance | p-value | Variance | p-value | |
| Sites | 0.004 | |||||||||
| Populations | <0.0001 | <0.0001 | 0.0001 | 0.16 | 0.48 | |||||
| Sites × populations | 0.02 | 0.48 | <0.0001 | 0.78 | ||||||
| Families (populations) | 60.06 | <0.0001 | 0.14 | <0.0001 | 0.0016 | 0.0003 | 0.030 | <0.0001 | 0.007 | 0.02 |
| Sites × families (populations) | 19.98 | <0.0001 | 0.0 | 0.001 | 0.32 | 0.001 | 0.37 | |||
| Replicates (site) | 117.86 | <0.0001 | 0.0005 | 0.008 | ||||||
| Error | 1250.81 | 0.63 | 0.0238 | 0.464 | 0.499 | |||||
| Heritability | 0.14 (0.04) | 0.55 (0.08) | 0.18 (0.07) | 0.18 (0.04) | 0.04 (0.02) | |||||
| 1) Scored according to Krutzsch (1973). 2) Proportion of shoot growth accomplished at June 30. 3) Assessed at Kvatninga. 4) Assessed at Stiklestad. | ||||||||||
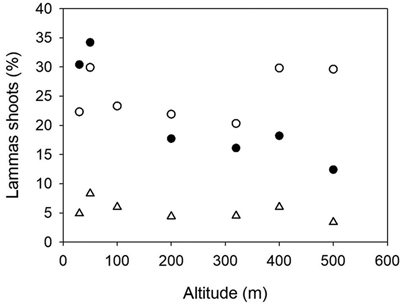
Fig. 4. Norway spruce populations from Mid-Norway. Relationship between the percentages of trees with lammas shoots at Kvatninga 2000 (white circles) and 2003 (triangles) and Stiklestad 2003 (black circles) and the altitude of the populations.
| Table 5. Norway spruce families from Mid-Norway. Estimates of genetic correlations (with standard errors or p-values) for traits measured in the short term trial at Stiklestad and Kvatninga and for bud set assessed in the nursery (Stiklestad). P-values are given when inference are based on Pearson-correlations between BLU-predicted breeding values. | |||||
| Bud flush | Growth cessation 1) | Lammas shoots | Damage | Bud set 2) | |
| Height | 0.58 (0.12) | –0.09 (0.22) | 0.32 (0.16) | 0.42 (p < 0.0001) | –0.24 (p = 0.04) |
| Bud flush | 0.62 (0.16) | 0.45 (0.12) | 0.43 (p < 0.0001) | –0.17 (ns) | |
| Growth cessation | 0.32 (0.26) | 0.29 (p = 0.01) | 0.17 (ns) | ||
| Lammas shoots | 0.27 (p = 0.01) | –0.08 (ns) | |||
| Damage | –0.05 (ns) | ||||
| 1) Proportion of shoot growth accomplished at June 30. 2) Measured in the nursery (Stiklestad). | |||||
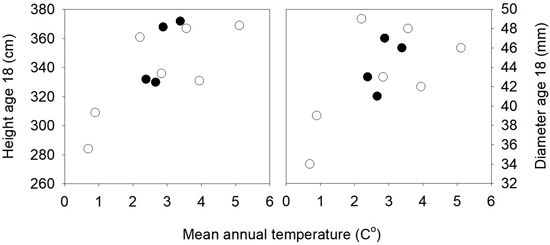
Fig. 5. Norway spruce populations from Mid-Norway. Mean heights and diameters of the populations at age 18 years from seed in three field trials plotted against the mean annual temperatures of the populations. Black circles denote the southern and white circles the northern transect populations.
| Table 6. Norway spruce populations and families from Mid-Norway. Mean values across three field trials at age 18 year of selected and all families for each of three subset of populations. | ||||
| Subset of populations | Height cm | Diameter mm | Mortality % | Damage % |
| Southern transect populations > 250 m altitude | ||||
| Selected families | 390 | 49 | 11.5 | 29.4 |
| All families | 350 | 46 | 18.1 | 21.7 |
| Northern transect populations < 250 m altitude | ||||
| Selected families | 368 | 44 | 18.8 | 17.8 |
| All families | 353 | 43 | 16.4 | 23.8 |
| Northern transect populations > 250 m altitude | ||||
| Selected families | 313 | 37 | 13.1 | 28.3 |
| All families | 321 | 40 | 19.0 | 21.5 |