| Table 1. The upper limit concentrations (quality limit, QL) used in the study to indicate a good water quality. Measured heavy metals and earth alkaline metal, barium, with their chemical signs and density values (kg l–1) are indicated. | |||
| Measured parameter | Density (kg l–1) | Quality limit (QL) | Source |
| Heavy metals | |||
| Arsenic (As) | 5.72 | 10 µg l–1 | Finlex (2001) |
| Cadmium (Cd) | 8.65 | 5 µg l–1 | Finlex (2001) |
| Cobalt (Co) | 8.90 | 1 µg l–1 | Lahermo et al. (2002) |
| Copper (Cu) | 8.96 | 2000 µg l–1 | Finlex (2001) |
| Chromium (Cr) | 7.19 | 50 µg l–1 | Finlex (2001) |
| Lead (Pb) | 11.35 | 10 µg l–1 | Finlex (2001) |
| Molybdenum (Mo) | 10.22 | 70 µg l–1 | Lahermo et al. (2002) |
| Nickel (Ni) | 8.90 | 20 µg l–1 | Finlex (2001) |
| Zinc (Zn) | 7.13 | 3000 µg l–1 | Finlex (2001) |
| Earth alkaline metal | |||
| Barium (Ba) | 3.59 | 700 µg l–1 | WHO (2011) |
| Table 2. Background information of the experimental area near Jämsä, central Finland. | |
| Experimental area | |
| Location | 62°02´N, 24°54´E |
| Vegetation | Boreal |
| Forest land | wetlands, upland mineral soils |
| Mean precipitation (mm a–1) 1 | 636 |
| Mean effective temperature sum (degree days) 1 | 1333 |
| Mean growing season length (days) 1 | 170 |
| 1 Lindroos et al. (2008); mean for the period 1998–2004, data from the closest intensive monitoring plot of forest ecosystems in Finland for the experimental area (Juupajoki 61°52´N, 24°13´E, UN/ECE ICP Forests, Level II plot). | |
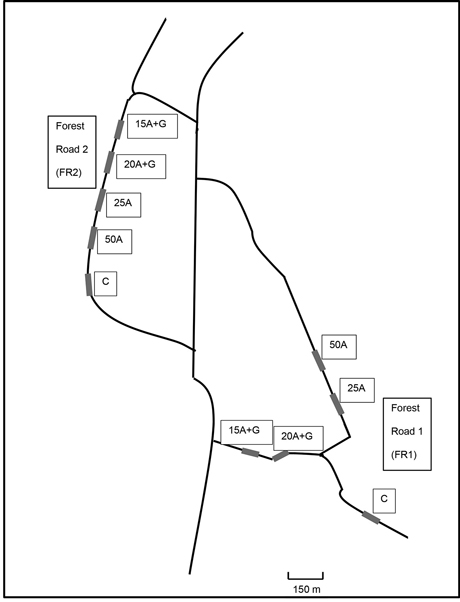
Fig. 1. Schematic picture of the location of test road sections containing ash structures near Jämsä, central Finland. Treatments: C = control (no ash), 15A + G = 15 cm layer of ash + gravel, 20A + G = 20 cm layer of ash + gravel, 25A = 25 cm layer of ash, 50A = 50 cm layer of ash.
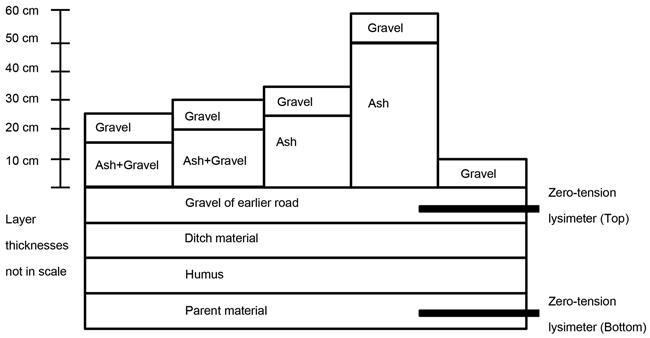
Fig. 2. The structure of the forest roads and location of zero-tension lysimeters.
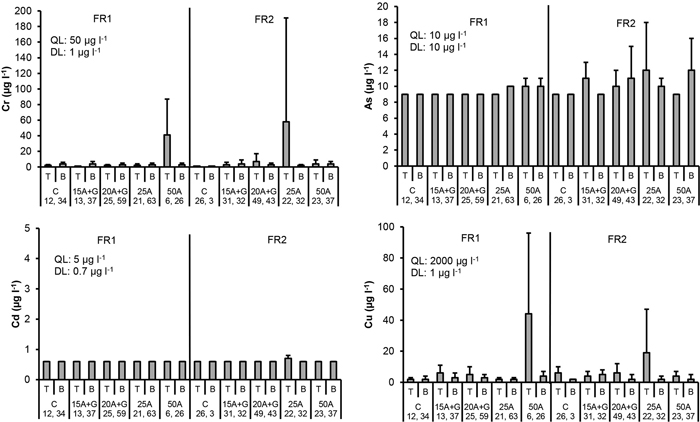
Fig. 3. Cr, As, Cd and Cu concentrations in percolation water collected from the top (T) and bottom (B) part of the two experimental forest roads (FR1, FR2). Mean and standard deviation for 2011–2014. Treatments: C = control (no ash), 15A + G = 15 cm layer of ash + gravel, 20A + G = 20 cm layer of ash + gravel, 25A = 25 cm layer of ash, 50A = 50 cm layer of ash. QL = quality limit (see Table 1). DL = detection limit of analytical equipment. Number of samples is indicated for each treatment plot.
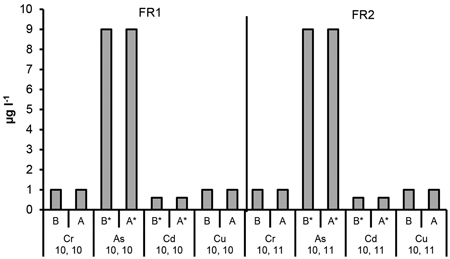
Fig. 4. The Cr, As, Cd and Cu concentrations in ditch water collected before (B, no ash effect) and after (A, incl. possible ash effect) the ditch crossed the experimental forest road containing ash layers (FR1, FR2). Mean and standard deviation for 2011–2014. * = below DL. Number of samples is indicated for each parameter.
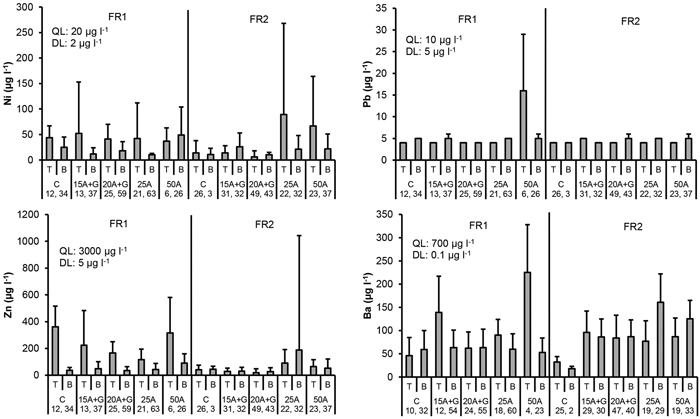
Fig. 5. Ni, Pb, Zn and Ba concentrations in percolation water collected from the top (T) and bottom (B) part of the two experimental forest roads (FR1, FR2). Mean and standard deviation for 2011–2014. Treatments: C = control (no ash), 15A + G = 15 cm layer of ash + gravel, 20A + G = 20 cm layer of ash + gravel, 25A = 25 cm layer of ash, 50A = 50 cm layer of ash. QL = quality limit (see Table 1). DL = detection limit of analytical equipment. Number of samples is indicated for each treatment plot.
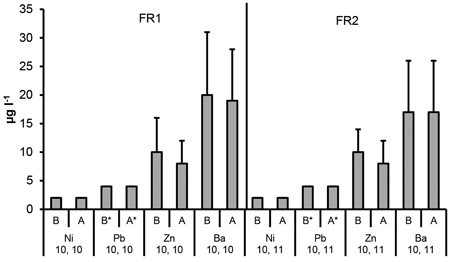
Fig. 6. The Ni, Pb, Zn and Ba concentrations in ditch water collected before (B, no ash effect) and after (A, incl. possible ash effect) the ditch crossed the experimental forest road containing ash layers (FR1, FR2). Mean and standard deviation for 2011–2014. * = below DL. Number of samples is indicated for each parameter.
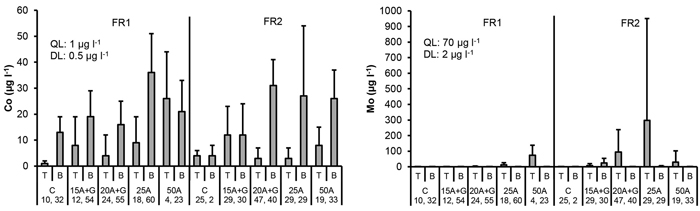
Fig. 7. Co and Mo concentrations in percolation water collected from the top (T) and bottom (B) part of the two experimental forest roads (FR1, FR2). Mean and standard deviation for 2011–2014. Treatments: C = control (no ash), 15A + G = 15 cm layer of ash + gravel, 20A + G = 20 cm layer of ash + gravel, 25A = 25 cm layer of ash, 50A = 50 cm layer of ash. QL = quality limit (see Table 1). DL = detection limit of analytical equipment. Number of samples is indicated for each treatment plot.
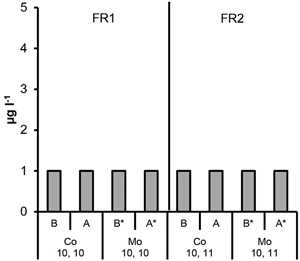
Fig. 8. The Co and Mo concentrations in ditch water collected before (B, no ash effect) and after (A, incl. possible ash effect) the ditch crossed the experimental forest road containing ash layers (FR1, FR2). Mean and standard deviation for 2011–2014. * = below DL. Number of samples is indicated for each parameter.
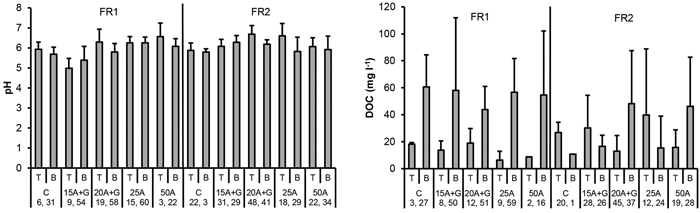
Fig. 9. pH and DOC concentration in percolation water collected from the top (T) and bottom (B) part of the two experimental forest roads (FR1, FR2). Mean and standard deviation for 2011–2014. Treatments: C = control (no ash), 15A + G = 15 cm layer of ash + gravel, 20A + G = 20 cm layer of ash + gravel, 25A = 25 cm layer of ash, 50A = 50 cm layer of ash. Number of samples is indicated for each treatment plot.
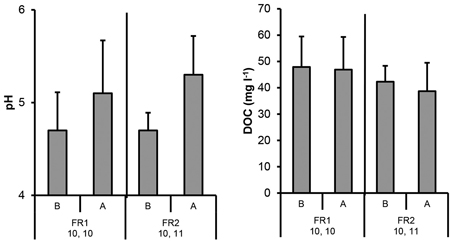
Fig. 10. The pH and DOC concentrations in ditch water collected before (B, no ash effect) and after (A, incl. possible ash effect) the ditch crossed the experimental forest road containing ash layers (FR1, FR2). Mean and standard deviation for 2011–2014. Number of samples is indicated.