| Table 1. Stand characteristics of the ground truth data from the 1751 plots. | ||||
| Minimum | Maximum | Average | Stdev | |
| Dgm (cm) | 0.7 | 43.8 | 16.7 | 6.5 |
| Hgm (m) | 1.5 | 28.1 | 13.7 | 4.9 |
| Age (a) | 10 | 165 | 50.4 | 28.4 |
| G (m2 ha–1) | 0.2 | 67.5 | 17.5 | 9.1 |
| V tot (m3 ha–1) | 0.6 | 816.8 | 130.2 | 121.5 |
| Tree species proportions | ||||
| Pine (%) | 0 | 100 | 64 | 39.8 |
| Spruce (%) | 0 | 100 | 18 | 33.7 |
| Broad-leaved trees (%) | 0 | 100 | 18 | 27.0 |
| Dgm = Diameter at breast height of the median basal area tree Hgm = Height of the median basal area tree Age = Age of the mean basal area tree G = Basal area of the stand V tot = Total volume of the stand | ||||
| Table 2. Number of plots within site type classes (Hotanen et al. 2018; Laine et al. 2018) in the ground truth data. | |
| Number | |
| Very rich sites (OMaT) | 8 |
| Rich sites (OMT) | 168 |
| Damp sites (MT) | 649 |
| Sub-dry sites (VT) | 694 |
| Dry sites (CT) | 213 |
| Barren sites (ClT) | 12 |
| Rocky or sandy areas (Rsa) | 7 |
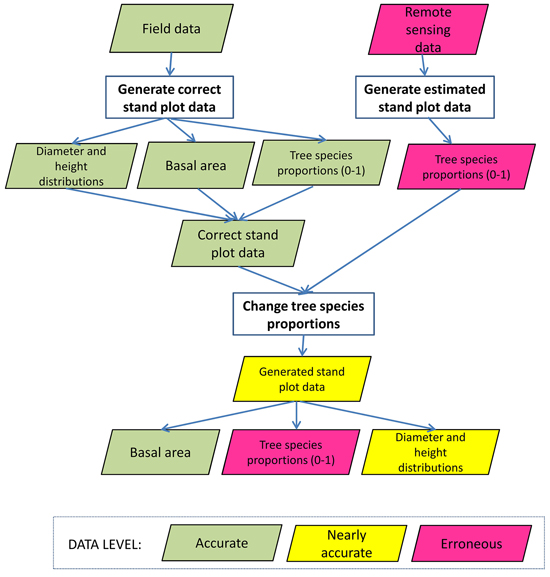
Fig. 1. Flow chart of the generation of the erroneous tree species proportions for each study plot. In the chart, green data box denotes that stand characteristics introduced in the box is accurate, yellow denotes it is nearly accurate and red box denotes it is erroneous.
| Table 3. The error matrix of Site type data (OMaT Very rich sites; OMT Rich sites; MT Damp sites; VT Sub-dry sites; CT Dry sites; ClT Barren sites; Rsa Rocky or sandy areas). | |||||||||
| Ground truth data | |||||||||
| OMaT | OMT | MT | VT | CT | ClT | Rsa | Total | ||
| Generated data | OMaT | 71 | 252 | 8 | 0 | 0 | 0 | 0 | 331 |
| OMT | 9 | 1164 | 894 | 7 | 0 | 0 | 0 | 2074 | |
| MT | 0 | 259 | 4632 | 865 | 6 | 0 | 0 | 5762 | |
| VT | 0 | 5 | 944 | 5226 | 273 | 1 | 0 | 6449 | |
| CT | 0 | 0 | 12 | 835 | 1597 | 7 | 0 | 2451 | |
| ClT | 0 | 0 | 0 | 7 | 249 | 96 | 13 | 365 | |
| Rsa | 0 | 0 | 0 | 0 | 5 | 16 | 57 | 78 | |
| Total | 80 | 1680 | 6490 | 6940 | 2130 | 120 | 70 | 17510 | |
| Table 4. RMSEs and biases of the tree species proportions with four remote sensing data sets (relative RMSEs and biases are in the parenthesis). | ||||
| Data set | Pine, m2 ha–1 (%) | Spruce, m2 ha–1 (%) | Broad-leaved trees, m2 ha–1 (%) | |
| RMSE | LIDAR2D | 4.1 (39.1) | 4.1 (102.5) | 2.8 (91.4) |
| 2D | 5.1 (48.5) | 4.9 (122.3) | 3.3 (106.8) | |
| 3D2D | 5.0 (48.0) | 4.6 (114.8) | 3.1 (98.4) | |
| Satellite | 6.2 (59.5) | 5.4 (135.3) | 3.7 (117.5) | |
| Bias | LIDAR2D | –0.5 (–4.4) | 0.1 (3.3) | 0.3 (10.5) |
| 2D | –0.7 (–7.0) | 0.3 (6.7) | 0.5 (14.8) | |
| 3D2D | –0.6 (–6,1) | 0.3 (6.4) | 0.4 (12.3) | |
| Satellite | –0.6 (–5.6) | 0.3 (7.0) | 0.3 (9.9) | |
| Table 5. Species-wise and overall classification accuracies of dominant tree species of four remote sensing data sets without and with randomisation of classifications of tree species proportions. | ||||
| Method | Pine (%) | Spruce (%) | Broad-leaved trees (%) | Total (%) |
| LIDAR2D | 91.0 | 49.3 | 51.6 | 78.9 |
| 2D | 91.4 | 41.9 | 38.1 | 76.0 |
| 3D2D | 92.5 | 35.6 | 37.7 | 75.6 |
| Satellite | 87.5 | 41.6 | 35.8 | 72.9 |
| Random, LIDAR2D | 69.9 | 21.6 | 23.5 | 55.7 |
| Random, 2D | 68.3 | 22.3 | 23.5 | 54.7 |
| Random, 3D2D | 68.2 | 17.7 | 25.5 | 54.1 |
| Random, satellite | 68.3 | 22.0 | 17.7 | 53.8 |
| Table 6. Mean NPV losses (€ ha–1) for four remote sensing data sets at different interest rates. | ||||
| Interest rate | LIDAR2D | 2D | 3D2D | Satellite |
| 1% | 253.2 | 301.8 | 267.1 | 322.0 |
| 2% | 183.0 | 202.5 | 204.0 | 215.7 |
| 3% | 124.4 | 153.0 | 167.7 | 160.4 |
| 4% | 104.1 | 126.2 | 141.4 | 134.8 |
| 5% | 108.6 | 126.7 | 141.9 | 140.7 |
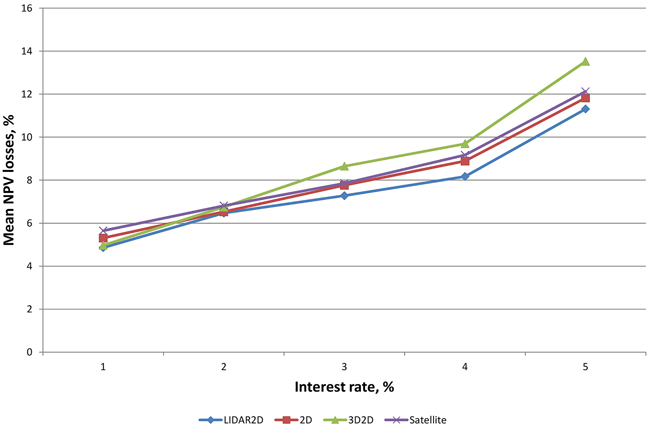
Fig. 2. Relative mean NPV losses at different interest rates.
| Table 7. Proportions of the plots with NPV losses at different interest rates. | ||||
| Plot proportions, % | ||||
| Interest rate, % | LIDAR2D | 2D | 3D2D | Satellite |
| 1 | 24.8 | 27.1 | 25.6 | 27.2 |
| 2 | 28.2 | 31.0 | 30.2 | 31.6 |
| 3 | 26.5 | 30.6 | 30.0 | 31.7 |
| 4 | 25.9 | 28.9 | 29.7 | 29.9 |
| 5 | 23.2 | 25.9 | 25.4 | 28.1 |
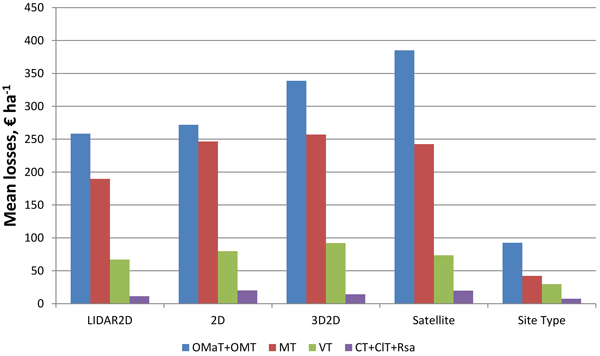
Fig. 3. Mean NPV losses of the plots at interest rate of 3% in relation to the site type of the plots, when species-wise proportion errors (LIDAR, 2D, 3D2D, Satellite) and site type errors (Site Type) are considered (OMaT Very rich sites; OMT Rich sites; MT Damp sites; VT Sub-dry sites; CT Dry sites; ClT Barren sites; Rsa Rocky or sandy areas).
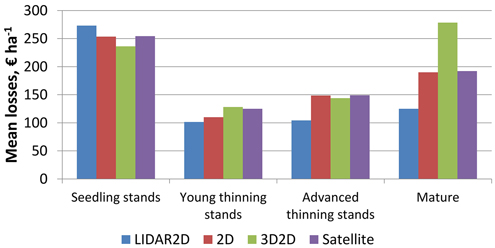
Fig. 4. Mean NPV losses of the plots at interest rate of 3% in relation to the maturity of the stands within the plots, when species-wise proportion errors are considered.
| Table 8. Mean losses of the randomised remote sensing inventory data sets and site type data for all plots and for plots with sub-optimal treatment proposals with each data set at interest rate of 3%. Proportions of the sub-optimally treated plots are in parenthesis. | ||
| Mean losses, all plots, € | Mean losses, sub-optimally treated plots, € (proportions in parenthesis) | |
| Random, LIDAR2D | 203.7 | 540.4 (35.9%) |
| Random, 2D | 206.3 | 520.1 (37.9%) |
| Random, 3D2D | 218.5 | 522.5 (39.6%) |
| Random, Satellite | 211.0 | 519.8 (37.5%) |
| Random, Site Type | 92.1 | 421.4 |