| Table 1. Site and initial stand characteristics of the 1711 selected National Forest Inventory permanent plots. | ||||||
| Site index a) (m) | Stand age b) (years) | Diameter at breast height b) (cm) | Mean height b) (m) | Basal area (m2 ha–1) | No. of stems ha–1 | |
| Average | 21.7 | 79 | 20.6 | 15.5 | 21.2 | 2526 |
| Min | 8.0 | 17 | 5.7 | 8.0 | 0.5 | 32 |
| 5%-percentile | 13.0 | 25 | 10.6 | 8.5 | 8.1 | 318 |
| 95%-percentile | 32.0 | 155 | 33.5 | 24.0 | 38.3 | 7669 |
| Max | 38.0 | 255 | 59.7 | 35.0 | 61.7 | 28482 |
| Stdv | 5.7 | 42 | 7.3 | 4.9 | 9.3 | 2841 |
| a) Site index (H100) calculated based on site factors for Scots pine and Norway spruce, respectively (Hägglund and Lundmark 1977) b) Basal area weighted mean (ƩX×d2 / Ʃd2) | ||||||
| Table 2. Initial site and stand characteristics of the 57 blocks from the thinning experiment used for evaluating long-term Heureka simulations. | |||||||
| Latitude | Site index a) | Basal area (m2 ha–1) | No. of stems ha–1 | Top height (m) | Stand age (years) | ||
| Scots pine | Average | 21.3 | 24.1 | 2151 | 13.4 | 41.0 | |
| Min | 56°23´N | 14.8 | 14.6 | 1295 | 11.8 | 32.0 | |
| 40 blocks | Max | 67°29´N | 26.9 | 36.3 | 3585 | 15.4 | 58.0 |
| Stdv | 3.4 | 4.65 | 542 | 1.07 | 6.47 | ||
| Norway spruce | Average | 29.6 | 32.8 | 3136 | 13.8 | 29.8 | |
| Min | 56°06´N | 22.0 | 23.7 | 1346 | 12.6 | 23.0 | |
| 17 blocks | Max | 63°14´N | 32.3 | 39.0 | 4931 | 16.2 | 37.0 |
| Stdv | 2.6 | 4.90 | 1009 | 1.01 | 3.86 | ||
| a) Site index (H100) according to site factors (Hägglund and Lundmark 1977) | |||||||
| Table 3. Description of the thinning treatments used in the experiments that provided the data against which the Heureka simulations were evaluated. | |||||||
| Species | Treatment | Number of plots | No. of thinnings | First thinning | |||
| Thinning grade a) (%) | Thinning quotient b) | Basal area after thinning (m2 ha–1) | No. of stems ha–1 after thinning | ||||
| Scots pine | A | 40 | 3–4 | 25.5 | 0.73 | 17.9 | 1265 |
| B | 16 | 2–3 | 43.1 | 0.73 | 13.0 | 869 | |
| C | 40 | 1 | 59.4 | 0.73 | 9.6 | 563 | |
| D | 16 | 3–4 | 50.6 | 0.72 | 11.7 | 760 | |
| F | 40 | 3–4 | 24.3 | 1.16 | 18.1 | 1743 | |
| I | 40 | 0 | |||||
| Norway spruce | A | 17 | 3–6 | 22.3 | 0.71 | 25.2 | 1992 |
| B | 15 | 2–3 | 40.3 | 0.72 | 19.7 | 1408 | |
| C | 17 | 1 | 64.8 | 0.72 | 11.1 | 684 | |
| D | 9 | 4–6 | 43.9 | 0.71 | 19.4 | 1405 | |
| F | 10 | 3–5 | 20.8 | 1.18 | 25.8 | 2580 | |
| I | 17 | 0 | |||||
| a) Percentage of basal area removed b) Ratio of the diameters of removed and retained trees | |||||||
| Table 4. Summary of the evaluated basal area growth models and the alternative implementations of growth models in the Heureka system. | |||
| Name | Basal area growth model | Level | Remarks |
| Growth models | |||
| OLD_S | Ekö (1985) | Stand | Temporary NFI plots 1973–1977 |
| OLD_T | Söderberg (1986) | Tree | Temporary NFI plots 1973–1977 |
| NEW_S | Elfving (2010a) | Stand | Permanent NFI plots est. 1983–1987 |
| NEW_T | Elfving (2010a) | Tree | Permanent NFI plots est. 1983–1987 |
| Configurations of Heureka | |||
| HEU_OLD | Söderberg (1986) | Tree | OLD_T in use |
| HEU_NEW | Elfving (2010a) | Combined tree-stand | NEW_S+NEW_T in use |
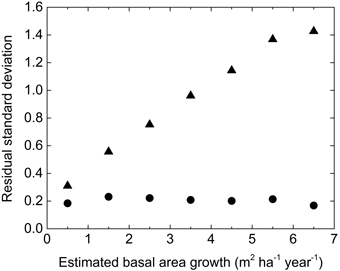
Fig. 1. The standard deviation of residuals by NEW_S for the NFI-data in absolute (res, triangle) and transformed (zres, circle) terms in different classes of estimated growth.
| Table 5. Basal area growth (iG, m2 ha–1) over a five year period based on observations of permanent National Forest Inventory plots and estimates generated using various basal area growth models. Residuals were calculated in absolute and relative terms. Significant deviation from 0 for relative residuals was marked with (*) (p < 0.001). | ||||||||
| Variable | 5 years basal area growth (m2 ha–1) | Residuals a) (m2 ha–1) | Relative residuals b) | |||||
| Mean | Std.dev. | Mean | Std.dev. | r2 | Mean | Std.dev. | r2 | |
| Observed | 2.24 | 1.53 | ||||||
| OLD_S | 2.40 | 1.38 | –0.15 | 0.84 | 0.70 | –0.043* | 0.23 | 0.72 |
| NEW_S | 2.32 | 1.27 | –0.07 | 0.76 | 0.75 | –0.030* | 0.22 | 0.75 |
| OLD_T | 2.30 | 1.42 | –0.06 | 0.87 | 0.67 | –0.008 | 0.24 | 0.70 |
| NEW_T | 2.12 | 1.17 | 0.13 | 0.82 | 0.71 | 0.033* | 0.23 | 0.73 |
| a) res = iGobs – iGest b) zres = ln(iGobs + 1) – ln(iGest + 1) + Szres2 / 2 | ||||||||
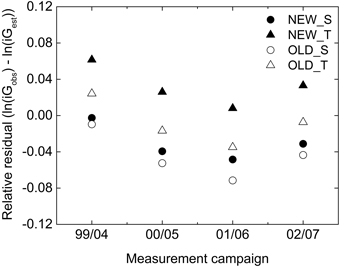
Fig. 2. Average relative residuals for basal area growth by OLD_S (unfilled circle), NEW_S (filled circle), OLD_T (unfilled triangle) and NEW_T (filled triangle) for plots measured in different measurement years in the NFI-data.
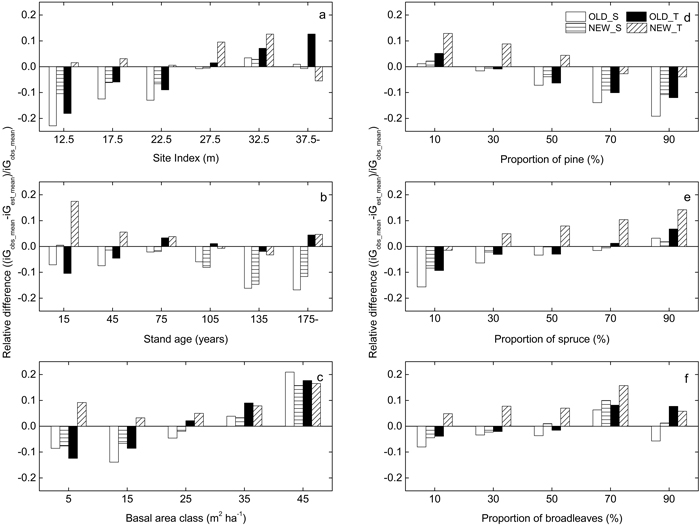
Fig. 3. Difference between average observed and estimated basal area growth (iG, m2 ha–1) over a five year period for the output of the different growth models (OLD_S (unfilled), NEW_S (horizontally hatched), OLD_T (black), NEW_T (obliquely hatched)) relative to observed data from the National Forest Inventory. The residuals are presented for different levels of: (a) the site index (H100), (b) initial total stand age, (c) initial basal area of trees with DBH values above 99 mm, the proportion of the overall basal area that consists of (d) Scots pine, (e) Norway spruce and (f) broadleaved tree species.
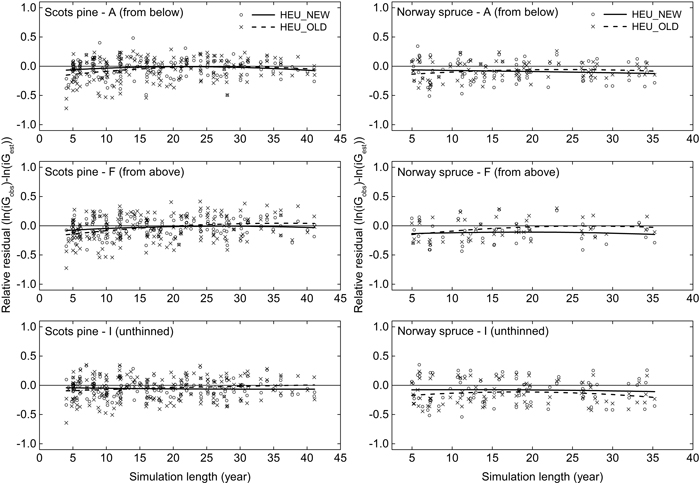
Fig. 4. Relative residuals for the mean annual basal area growth (iG, m2 ha–1 year–1) under different treatments and simulation lengths when comparing the output of Heureka simulations to data from a thinning experiment. Residuals and loess lines for Heureka simulations using HEU_NEW (circle, solid line) and HEU_OLD (cross, dashed line) are shown. Separate calculations were performed for plots of Scots pine and Norway spruce under treatments including light thinning from below (A) and above (F), as well as non-thinned plots (I). For a description of the thinning treatments, see Table 3.
| Table 6. The standard deviations of residuals by HEU_NEW and HEU_OLD (ln(obs)-ln(est)) for basal area and volume growth in the GG-trials over the whole observation period. The variation was split on within and between blocks by variance analyses. There were 40 pine blocks with 4–6 plots per block and 17 spruce blocks with 3–6 plots per block. | ||||||
| Species | Function | Basal area growth | Volume growth | |||
| within | between | within | between | |||
| Pine | HEU_NEW | 0.070 | 0.119 | 0.075 | 0.117 | |
| HEU_OLD | 0.068 | 0.182 | 0.075 | 0.163 | ||
| Spruce | HEU_NEW | 0.101 | 0.156 | 0.098 | 0.180 | |
| HEU_OLD | 0.099 | 0.123 | 0.093 | 0.155 | ||