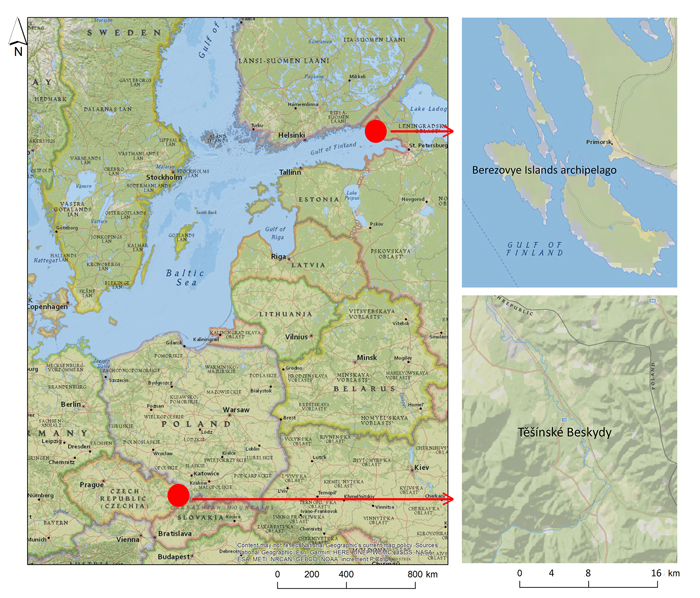
Fig. 1. Study areas: Berezovye Islands archipelago (Russia) and Těšínské Beskydy Mountains (Czech Republic).
| Table 1. Satellite multispectral (MS) and hyperspectral (HS) acquisition dates used in the study. | |||||||||
| Study area | Acquisition date in 2015 | ||||||||
| MS | HS | ||||||||
| Berezovye Islands | 11.04 | 6.05 | 13.05 | 14.06 | 30.06 | 15.08 | 31.08 | 11.10 | 30.05 |
| Těšínské Beskydy | 23.04 | 30.04 | 16.05 | 12.07 | 19.07 | 13.08 | 14.09 | 1.11 | 6.06 |
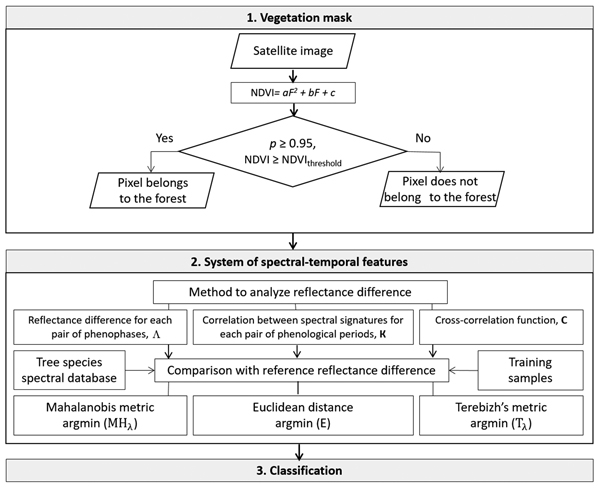
Fig. 2. Structure of the proposed method for tree species classification from multitemporal multispectral satellite data. F is a number of phenophase, a,b,c are approximation coefficients, NDVI is normalized difference vegetation index.
| Table 2. Number of training and verification samples, and number of pixel used for training and verification. Information is presented for each class in two study areas. | ||||
| Class | Training | Verification | ||
| sample | pixels | sample | pixels | |
| Berezovye Islands | ||||
| Spruce-pine bilberry-greenmoss | 2 | 19 | 1 | 9 |
| Spruce sphagnous and greenmoss | 1 | 25 | 1 | 25 |
| Tussock grass | 1 | 4 | 1 | 4 |
| Transistional (mesooligotrophic and mesotrophic) bogs | 1 | 9 | 1 | 9 |
| Raised (oligotrophic) bogs | 1 | 6 | 1 | 6 |
| Black alder ferny | 1 | 7 | 1 | 7 |
| Birch grassy | 2 | 88 | 2 | 88 |
| Pine bilberry | 3 | 70 | 2 | 47 |
| Pine greenmoss | 2 | 200 | 1 | 100 |
| Tešínské Beskydy | ||||
| Spruce 90–99% | 2 | 257 | 1 | 128 |
| Spruce 75–85%, beech 20–25% | 2 | 306 | 2 | 306 |
| Spruce 50%, beech 50% | 2 | 451 | 2 | 451 |
| Spruce 20–30%, beech 70–80% | 2 | 389 | 1 | 194 |
| Beech 90–99% | 2 | 344 | 1 | 172 |
| Pine 90% | 2 | 12 | 1 | 6 |
| Spruce 40–60%, pine 40–60% | 2 | 140 | 1 | 70 |
| Spruce 70%, pine 20% | 2 | 140 | 1 | 70 |
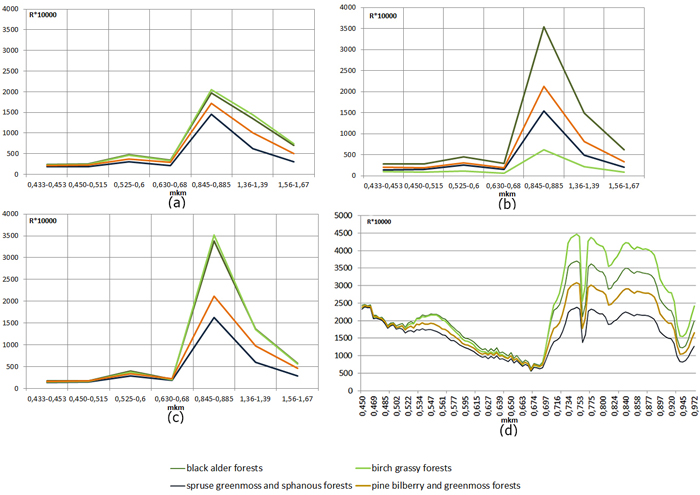
Fig. 3. Reflectance spectra of some forest types (Berezovye Islands) from multispectral satellite data (a), (b) (c) and hyperspectral satellite data (d) in phenological periods phen3 (а), phen4 (c), (d), and phen7(b). Phen3 is a sub-season of spring vegetation, phen4 is first half of summer, phen7 is main period of autumn. Y-axes variables are R (reflectance) × 1000. View larger in new window/tab.
| Table 3. Confusion matrix for the classification with multitemporal multispectral Landsat data. Berezovye Islands. | |||||||||
| 1 | 2 | 3 | 4 | 5 | 6 | 7 | 8 | 9 | |
| 1 | 82.25 | 17.75 | 0.00 | 0.00 | 0.00 | 0.00 | 0.00 | 0.00 | 0.00 |
| 2 | 36.31 | 61.88 | 0.00 | 0.00 | 0.00 | 0.00 | 0.00 | 1.24 | 0.58 |
| 3 | 0.00 | 0.00 | 98.03 | 0.00 | 0.00 | 0.00 | 1.97 | 0.00 | 0.00 |
| 4 | 0.00 | 0.00 | 0.00 | 100.00 | 0.00 | 0.00 | 0.00 | 0.00 | 0.00 |
| 5 | 0.00 | 0.00 | 0.00 | 0.00 | 92.60 | 0.00 | 0.25 | 6.77 | 0.37 |
| 6 | 0.00 | 0.00 | 0.00 | 0.00 | 0.00 | 100.00 | 0.00 | 0.00 | 0.00 |
| 7 | 0.00 | 0.00 | 0.00 | 0.00 | 5.41 | 0.00 | 66.43 | 14.94 | 13.22 |
| 8 | 1.12 | 0.00 | 0.00 | 0.00 | 2.98 | 0.00 | 6.47 | 56.54 | 32.90 |
| 9 | 0.00 | 0.00 | 0.00 | 0.00 | 0.00 | 0.00 | 0.80 | 24.41 | 74.79 |
| 1 – spruce–pine bilberry–green moss; 2 – spruce sphagnous and green moss; 3 – tussock grass; 4 – transitional (mesooligotrophic and mesotrophic) bogs; 5 – raised (oligotrophic) bogs; 6 – black alder ferny; 7 – birch grassy; 8 – pine bilberry; 9 – pine green moss. Columns in the matrices are classes identified after processing within control sample. Rows are initial classes on the control sample (actual class). Diagonal elements indicate the number of points belonging to both the control and the resulting class of image processing. | |||||||||
| Table 4. Confusion matrix for the classification with multitemporal Landsat data. Těšínské Beskydy. | ||||||||
| 1 | 2 | 3 | 4 | 5 | 6 | 7 | 8 | |
| 1 | 88.00 | 5.00 | 0.68 | 2.59 | 3.97 | 0.16 | 0.00 | 0.43 |
| 2 | 1.40 | 71.00 | 4.90 | 3.30 | 4.98 | 5.73 | 5.90 | 3.68 |
| 3 | 4.50 | 7.00 | 68.10 | 7.00 | 3.95 | 3.83 | 2.50 | 3.51 |
| 4 | 3.05 | 6.84 | 6.05 | 74.00 | 6.30 | 2.30 | 1.02 | 0.91 |
| 5 | 1.60 | 4.52 | 0.71 | 7.50 | 86.00 | 0.00 | 0.20 | 0.00 |
| 6 | 0.00 | 0.00 | 1.32 | 4.53 | 4.26 | 79.00 | 8.50 | 2.60 |
| 7 | 2.80 | 1.33 | 7.01 | 1.96 | 1.94 | 3.05 | 80.20 | 2.30 |
| 8 | 4.18 | 1.03 | 6.71 | 1.08 | 0.39 | 5.89 | 2.70 | 79.00 |
| 1 – spruce 90–100%; 2 – spruce 80%, beech 20%; 3 – spruce 50%, beech 50%; 4 – spruce 20%, beech 80%; 5 – beech 100%; 6 – pine 90–100%; 7 – pine 50%, spruce 50%; 8 – pine 20%, spruce 80%. Columns in the matrices are classes identified after processing within control sample. Rows are initial classes on the control sample (actual class). Diagonal elements indicate the number of points belonging to both the control and the resulting class of image processing. | ||||||||
| Table 5. Cohen’s kappa coefficient for the assessment of classification accuracy. | |||
| Satellite data used for classification | Berezovye Islands | Těšínské Beskydy | |
| Multitemporal multispectral data | Λ | 0.74 | 0.81 |
| K | 0.78 | 0.77 | |
| C | 0.80 | 0.75 | |
| Hyperspectral data (single Resurs-P scene) | 0.67 | 0.78 | |
| Multispectral data (single Landsat scene) | 0.47 | 0.44 | |
| Λ, K and C are matrices used in the system of new spectral–temporal features for forest classes. | |||
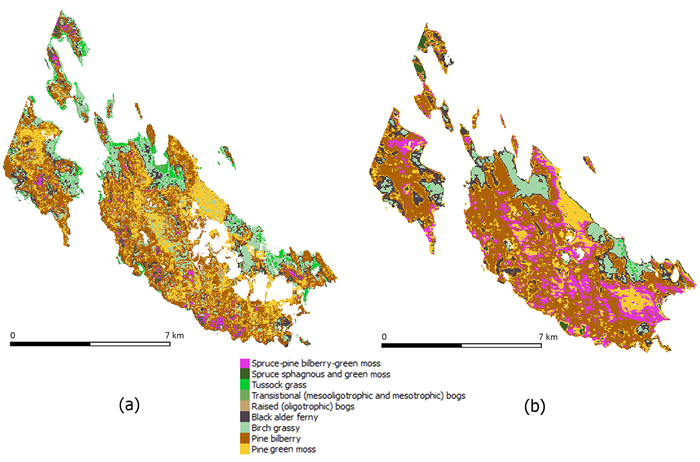
Fig. 4. Map of forest stands in Berezovye Islands resulting (a) from multitemporal data, and (b) from a single hyperspectral image.
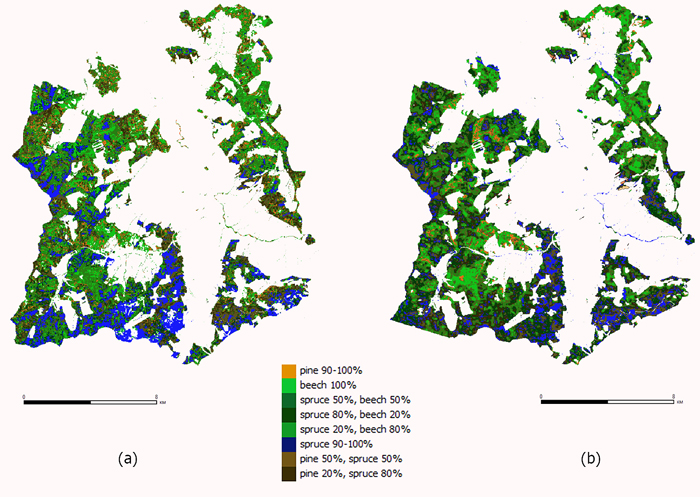
Fig. 5. Map of forest stand in Těšínské Beskydy resulting (a) from multitemporal data, and (b) from a single hyperspectral image.