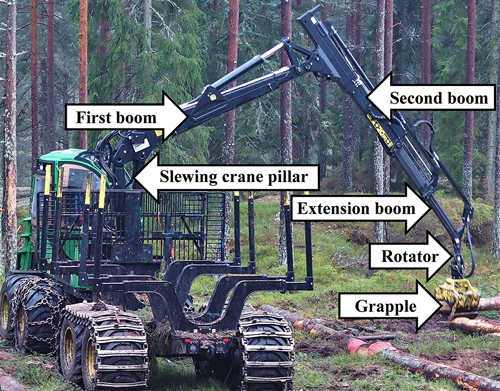
Fig. 1. The knuckle-boom system used in Nordic cut-to-length forwarders consists of a slewing crane pillar, first boom (or “pivoting mid boom”), second boom (or “outer boom”), extension boom, rotator and unlimited rotatable grapple.
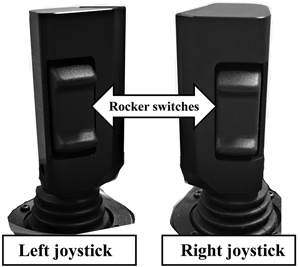
Fig. 2. Standard joysticks used in all Nordic cut-to-length forwarders.
| Table 1. Levels of significance (p-values) and explained variance (R2, adjusted) obtained from the analysis of covariance (ANCOVA) in which a is Operator, b(a) is Stand nested within Operator, c is System, b(a)×c is the fixed interaction between Stand (nested within Operator) and System, and α×c is the fixed interaction between Operator and System. Moreover, d and e are the fixed effects of the covariates Loading-drive distance and Unloading-drive distance. Hyphen “-” means that the covariate did not contribute to the model and was removed from the final model; an empty cell means that the effect was not tested at all. The unit of observation is one load, and the number of loads is 1238. Significant values (p ≤ 0.05) in bold. | ||||||||
| p-value | R2 | |||||||
| Dependent variable (sort) | a | b(a) | c | b(a)×c | a×c | d | e | adj. (%) |
| Loading and Unloading pooled (minutes load–1) | <0.001 | <0.001 | <0.001 | 0.742 | 0.645 | <0.001 (1 | <0.001 (2 | 63.5 |
| Loading phase (minutes load–1) | 0.010 | <0.001 | 0.005 | 0.599 | 0.728 | <0.001 (1 | 65.6 | |
| Loading-crane work only, i.e. no drive (minutes load–1) | <0.001 | <0.001 | <0.001 | 0.284 | 0.055 | <0.001 (1 | 45.3 | |
| Loading drive only, i.e. no crane (minutes load–1) | <0.001 | <0.001 | 0.399 | 0.216 | 0.436 | <0.001 | 87.4 | |
| Loading drive, i.e. including crane work (minutes load–1) | <0.001 | <0.001 | 0.530 | 0.004 | 0.005 | <0.001 | 81.3 | |
| Crane in use during loading drive (% of loading-drive time) | <0.001 | <0.001 | 0.166 | 0.158 | <0.001 | - | 48.1 | |
| Loading-crane cycle time (seconds cycle–1) (1 | <0.001 | <0.001 | <0.001 | 0.029 | 0.184 | - | 39.1 | |
| Number of loading-crane cycles (count load–1) | <0.001 | <0.001 | 0.413 | 0.225 | 0.983 | <0.001 (1 | 51.1 | |
| Loading-drive speed (km h–1) | <0.001 | <0.001 | 0.573 | 0.001 | <0.001 | <0.001 (1 | 68.1 | |
| Unloading phase (minutes load–1) | <0.001 | 0.023 | 0.001 | 0.838 | 0.275 | <0.001 (2 | 41.5 | |
| Unloading-crane work only, i.e. no drive (minutes load–1) (3 | <0.001 | 0.002 | <0.001 | 0.666 | 0.268 | <0.001 (2 | 26.9 | |
| Unloading drive, i.e. including crane work (minutes load–1) | <0.001 | 0.003 | 0.224 | 0.561 | 0.066 | <0.001 | 77.6 | |
| Unloading-crane cycle time (seconds cycle–1) (1 | <0.001 | <0.001 | <0.001 | 0.590 | 0.006 | - | 35.5 | |
| Number of unloading-crane cycles (count load–1) | <0.001 | 0.170 | 0.136 | 0.827 | 0.121 | <0.001 (2 | 18.7 | |
| When meeting the ANCOVA assumptions required, dependent variables and/or covariates were transformed accordingly: 1) Ln transformation 2) Ln + 1 transformation (data included a minor number of zeros) 3) Square-root transformation | ||||||||
| Table 2. Estimated marginal means (EMM) for the dependent variables. EMMs are followed by medians, 5th and 95th per centiles in parentheses. CBC stands for conventional boom control, while IBC stands for Intelligent Boom Control. Relative differences in EMMs, that are statistically significant between the systems (CBC, IBC), are given in percentages (i.e. 100% – IBC/CBC). A hyphen “-” indicates no significant difference between the systems. ANCOVA results are presented in Table 1. | |||||
| CBC | IBC | Significant difference | |||
| Dependent variable (sort) | EMM | Median (5th; 95th) | EMM | Median (5th; 95th) | |
| Loading and Unloading pooled (minutes load–1) (1 | 31.8 | 31.6 (14.1; 56.0) | 30.0 | 28.9 (13.4; 51.3) | 5.8% |
| Loading phase (minutes load–1) (1 | 23.2 | 22.3 (9.3; 43.2) | 22.0 | 20.6 (8.3; 39.2) | 5.2% |
| Loading-crane work only, i.e. no drive (minutes load–1) (1 | 15.1 | 15.1 (5.2; 28.8) | 13.8 | 13.6 (4.5; 24.9) | 8.6% |
| Loading drive only, no crane (minutes load–1) (1 | 4.3 | 3.3 (0.6; 12.2) | 4.3 | 3.4 (0.5; 12.7) | - |
| Loading drive, i.e. including crane work (minutes load–1) (1 | 8.3 | 6.8 (2.0; 19.0) | 8.2 | 6.9 (1.9; 19.3) | - |
| Crane in use during loading drive (% of driving time) | 46.6 | 43.2 (13.6; 88.4) | 48.1 | 40.9 (11.0; 89.9) | - |
| Loading-crane cycle time (seconds cycle–1) (2 | 24.2 | 24.2 (19.2; 32.2) | 22.9 | 22.5 (18.2; 30.0) | 5.6% |
| Number of loading-crane cycles (count load–1) (1 | 43.5 | 43.0 (19.0; 70.0) | 43.0 | 41.0 (19.0; 71.0) | - |
| Loading-drive speed (km h–1) (1 | 1.6 | 1.5 (0.8; 2.6) | 1.6 | 1.7 (0.8; 2.5) | - |
| Unloading phase (minutes load–1) (1 | 8.7 | 8.2 (4.0; 15.3) | 8.0 | 7.6 (3.4; 15.3) | 7.9% |
| Unloading-crane work only, i.e. no drive (minutes load–1) (1, (2 | 7.1 | 7.2 (3.5; 13.1) | 6.4 | 6.7 (3.0; 12.5) | 9.7% |
| Unloading drive (minutes load–1) (1 | 1.3 | 0.8 (0.1; 3.6) | 1.4 | 0.9 (0.1; 4.1) | - |
| Unloading-crane cycle time (seconds cycle–1) (2 | 23.4 | 23.5 (18.5; 32.6) | 21.8 | 22.0 (17.0; 29.0) | 6.8% |
| Number of unloading-crane cycles (count load–1) (1 | 19.1 | 19.0 (9.0; 29.0) | 18.6 | 19.0 (8.0; 30.0) | - |
| 1) EMM at statistically equalized Loading- and/or Unloading-drive distances, i.e. approximately 224 m for Loading-drive distance and 45 m for Unloading-drive distance (exact distances vary slightly depending on whether the covariate was transformed or not, see Table 1) 2) EMMs are back-transformed from the transformed data (see Table 1) | |||||