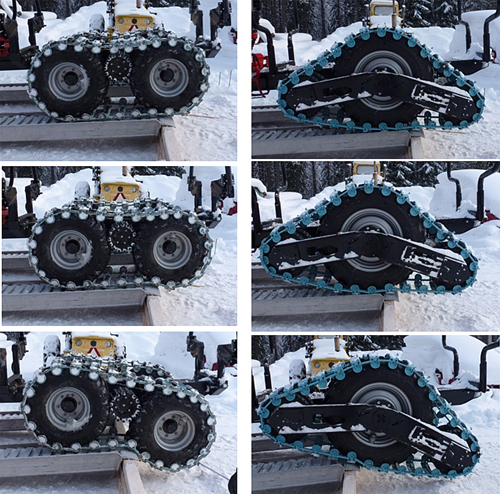
Fig. 1. Pictures of the two bogies when driving over an edge (e.g. cavity, ditch). The conventional bogie is shown on the left and the LTB on the right.
| Table 1. Results of total acceleration (ms–2), peak acceleration, roll and pitch (°) for LTB and a conventional bogie. The treatments are considered statistically different when the p-value is ≤ 0.05. Here pp means bogies passing parallel and op means one bogie passing the obstacle. | ||||||||||||
| Obstacle | Total acceleration | Peak acceleration | Roll | Pitch | ||||||||
| Conv. | LTB | p-value | Conv. | LTB | p-value | Conv. | LTB | p-value | Conv. | LTB | p-value | |
| 0.1m pp | 995.9 | 986.6 | 0.160 | 19.8 | 19.3 | 0.710 | 5.1 | 4.4 | 0.497 | 3.9 | 3.5 | 0.724 |
| 0.1m op | 994.1 | 989.8 | 0.013 | 15.5 | 16.0 | 0.723 | 4.5 | 8.2 | 0.082 | 3.3 | 2.9 | 0.145 |
| 0.2m pp | 996.4 | 990.4 | 0.358 | 22.3 | 20.8 | 0.372 | 7.5 | 4.4 | 0.044 | 5.0 | 3.3 | 0.010 |
| 0.2m op | 996.2 | 992.8 | 0.271 | 19.3 | 18.1 | 0.218 | 4.7 | 13.1 | <0.001 | 4.0 | 3.3 | 0.153 |
| 1m ditch | 994.4 | 990.9 | 0.145 | 14.3 | 14.9 | 0.635 | 5.8 | 6.5 | 0.546 | 5.6 | 2.7 | 0.002 |
| 1.5m ditch | 993.2 | 992.7 | 0.859 | 14.5 | 16.0 | 0.480 | 7.5 | 9.3 | 0.146 | 5.1 | 3.4 | 0.006 |
| Table 2. Free rolling resistance (N) for the LTB and a conventional bogie. | |||
| Parameter | Conv. bogie | LTB | p-value |
| Mean | 4230.5 | 2551.2 | 0.055 |
| Max | 7938.5 | 6058.9 | 0.942 |
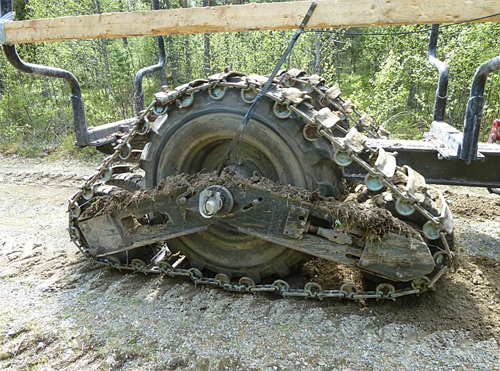
Fig. 2. The rear small wheel of the reversing LTB was pushed down to the ground when the drawbar pull force reached its maximum, thus creating a higher contact area.