| Table 1. Site index (H40, Tveite 1977) and characteristics of the taper sample trees. Mean values of diameter and height for sample trees within each site, with min-max in parenthesis. Diameter and bark thickness at breast height. Crown height up to the lowest green branch whorl. | |||||||
| Site no. | Site index (H40, m) | No. of taper trees | D (cm) | H (m) | Double bark (mm) | Crown height (m) | County |
| 25 | 21 | 15 | 27 (6–55) | 23 (7–34) | 14 | 11 | Akershus |
| 33 | 12 | 15 | 16 (7–26) | 16 (9–23) | 11 | 11 | Akershus |
| 37 | 12 | 15 | 23 (11–41) | 17 (10–24) | 17 | 9 | Nord-Trøndelag |
| 39 | 7 | 16 | 15 (7–24) | 13 (7–17) | 12 | 8 | Nord-Trøndelag |
| 42 | 20 | 15 | 23 (7–34) | 20 (9–25) | 11 | 15 | Akershus |
| 62 | 14 | 15 | 16 (10–32) | 15 (10–20) | 12 | 8 | Nordland |
| V70 | 24 | 2 | 81 (70–92) | 42 (41–43) | 27 | 23 | Hordaland |
| 91 | 23 | 16 | 14 (6–24) | 15 (7–22) | 8 | 7 | Akershus |
| 139 | 16 | 16 | 12 (4–21) | 10 (4–17) | 9 | 4 | Oppland |
| 143 | 12 | 15 | 23 (11–39) | 17 (10–24 | 18 | 8 | Nord-Trøndelag |
| 158 | 16 | 15 | 12 (3–20) | 11 (3–18) | 12 | 7 | Oppland |
| 162 | 19 | 15 | 24 (8–40) | 21 (8–27) | 16 | 12 | Oppland |
| 164 | 14 | 15 | 34 (20–51) | 26 (20–30) | 19 | 13 | Oppland |
| 168 | 23 | 15 | 11 (3–16) | 12 (4–19) | 6 | 8 | Østfold |
| 174 | 21 | 15 | 19 (4–34) | 13 (5–19) | 11 | 8 | Østfold |
| 176 | 20 | 15 | 23 (5–45) | 19 (4–27) | 12 | 12 | Oslo |
| 210 | 11 | 15 | 26 (7–44) | 18 (8–23) | 18 | 10 | Nord-Trøndelag |
| 214 | 18 | 17 | 18 (6–29) | 15 (6–23) | 9 | 9 | Sør-Trøndelag |
| 219 | 15 | 16 | 21 (5–34) | 19 (4–24) | 14 | 12 | Hedmark |
| 223 | 16 | 15 | 20 (7–39) | 17 (6–24) | 12 | 9 | Hedmark |
| 228 | 21 | 15 | 13 (10–18) | 13 (11–17) | 8 | 7 | Oslo |
| 237 | 15 | 2 | 45 (42–48) | 27 (26–28) | 21 | 10 | Sør-Trøndelag |
| 239 | 18 | 15 | 24 (10–48) | 20 (10–26) | 15 | 10 | Sør-Trøndelag |
| 252 | 16 | 5 | 41 (31–53) | 23 (18–25) | 22 | 5 | Oppland |
| 253 | 14 | 5 | 18 (11–28) | 13 (7–21) | 12 | 5 | Oppland |
| 254 | 15 | 5 | 20 (11–42) | 13 (8–22) | 13 | 8 | Oppland |
| 262 | 21 | 15 | 19 (11–35) | 18 (11–26) | 10 | 10 | Akershus |
| 348 | 15 | 1 | 12 (12–12) | 13 (13–13) | 25 | 3 | Aust-Agder |
| 377 | 13 | 11 | 18 (12–25) | 17 (11–22) | 15 | 11 | Buskerud |
| 402 | 21 | 15 | 22 (10–36) | 20 (11–26) | 12 | 10 | Vestfold |
| 406 | 22 | 15 | 18 (11–23) | 20 (13–24) | 10 | 14 | Vestfold |
| 452 | 13 | 15 | 12 (41–6) | 10 (3–14) | 9 | 4 | Nord-Trøndelag |
| 459 | 25 | 15 | 25 (12–39) | 23 (16–27) | 10 | 14 | Telemark |
| 512 | 15 | 5 | 16 (12–15) | 14 (12–15) | 11 | 9 | Oslo |
| 514 | 11 | 7 | 10 (4–14) | 10 (4–15) | 8 | 4 | Hedmark |
| 519 | 20 | 4 | 12 (10–15) | 13 (9–16) | 9 | 7 | Hedmark |
| 540 | 19 | 4 | 11 (10–14) | 9 (8–11) | 7 | 2 | Østfold |
| 593 | 15 | 15 | 16 (8–23) | 14 (9–20) | 9 | 5 | Troms |
| 611 | 16 | 15 | 11 (3–21) | 10 (3–16) | 6 | 4 | Nordland |
| D = diameter at breast height; H = tree height from ground to top | |||||||
| Table 2. Parameters of the fixed-effects Kozak 97 model for stem taper over bark. | ||
| Parameter | Estimate | t value |
| a0 | 0.8795844 | 142.01 |
| a1 | 0.9457765 | 244.79 |
| a2 | 0.1061692 | 20.06 |
| b1 | 0.6624965 | 102.80 |
| b2 | 0.3781478 | 50.36 |
| b3 | –0.4418430 | –21.04 |
| b4 | –0.5154988 | –37.38 |
| b5 | 0.0197963 | 41.52 |
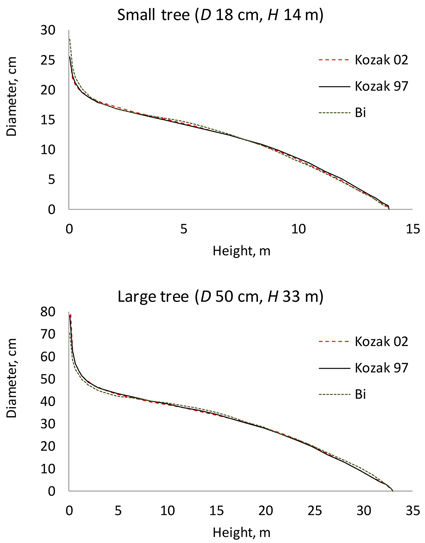
Fig. 1. Stem profiles predicted for a small and a large tree using the three tested taper functions. D is diameter at breast height; H is tree height from ground to top.
| Table 3. Parameters of the site index-dependent fixed-effects Kozak 97 model for stem taper over bark. | ||||
| Parameter | Constant | Slope coefficient | ||
| Estimate | t value | Estimate | t value | |
| a0 | 1.0233871 | 30.14 | –0.0074925 | –4.10 |
| a1 | 1.1012260 | 60.36 | –0.0084932 | –8.80 |
| a2 | –0.1160389 | –4.30 | 0.0119276 | 0.00 |
| b1 | 0.9717245 | 35.10 | –0.0161964 | –11.07 |
| b2 | 0.0787199 | 2.44 | 0.0153552 | 8.91 |
| b3 | –1.4247046 | –15.34 | 0.0488699 | 10.16 |
| b4 | –0.7021483 | –11.21 | 0.0105041 | 3.29 |
| b5 | 0.0486118 | 22.22 | –0.0014326 | –13.30 |
| Table 4. Parameters of the age-dependent fixed-effects Kozak 97 model for stem taper over bark. | ||||
| Parameter | Constant | Slope coefficient | ||
| Estimate | t value | Estimate | t value | |
| a0 | 0.8294 | 44.76 | 0.0006427 | 3.06 |
| a1 | 0.8600 | 69.38 | 0.0008741 | 7.21 |
| a2 | 0.2179 | 13.39 | –0.001193 | –7.13 |
| b1 | 0.5449 | 24.13 | 0.001253 | 5.84 |
| b2 | 0.5581 | 21.74 | –0.001806 | –7.32 |
| b3 | –0.07002 | –0.93 | –0.003486 | –4.68 |
| b4 | –0.4296 | –9.07 | –0.001174 | –2.51 |
| b5 | 9.725e-03 | 4.87 | 8.524e-05 | 4.57 |
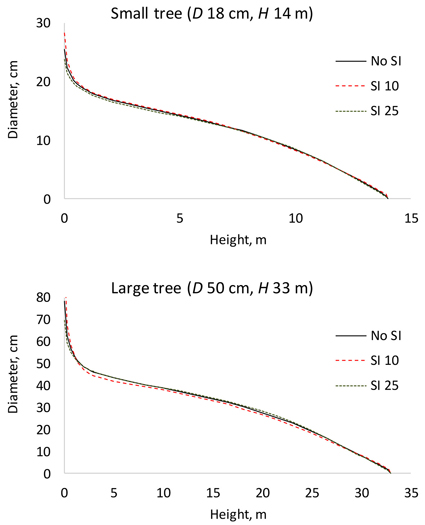
Fig. 2. Effect of site index (SI) on stem taper in a small and a large tree. The continuous line shows the stem taper according to the baseline model (Table 2). D is diameter at breast height; H is tree height from ground to top.
| Table 5. Parameters of the mixed-effects Kozak 97 model for stem taper over bark. | |||
| Parameter | Fixed effect | Standard deviation of random effect | |
| Estimate | t value | ||
| a0 | 0.9574392 | 115.43 | - |
| a1 | 0.9874995 | 192.41 | 0.006438417 |
| a2 | 0.0313538 | 4.77 | - |
| b1 | 0.6955883 | 53.39 | 0.087608971 |
| b2 | 0.2987029 | 49.33 | 0.079936209 |
| b3 | –0.7959772 | –68.74 | - |
| b4 | –0.3967074 | –11.80 | - |
| b5 | 0.0334238 | 49.34 | 0.009906016 |
| Table 6. Correlations of the random parameters of the mixed-effects model. | |||
| α1i | β1i | β2i | |
| β1i | –0.014 | ||
| β2i | 0.172 | –0.423 | |
| β5i | 0.180 | –0.547 | 0.187 |
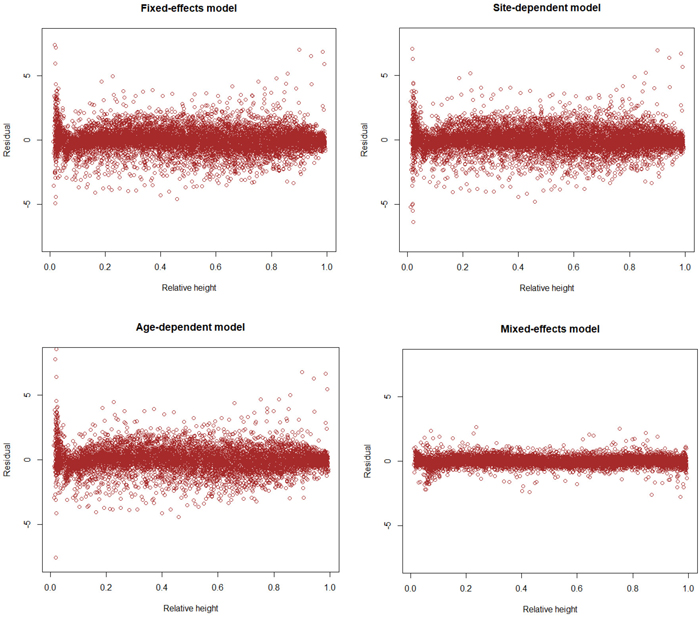
Fig. 3. Residuals of different models as a function of relative height (h/H). View larger in new window/tab.
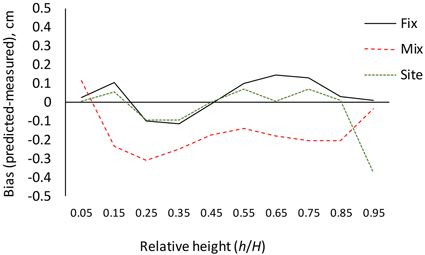
Fig. 4. Bias (predicted diameter – measured diameter) calculated for different relative heights with the fixed-effects model (Fix), fixed part of the mixed-effects model (Mix) and site index-dependent fixed-effects model (Site).
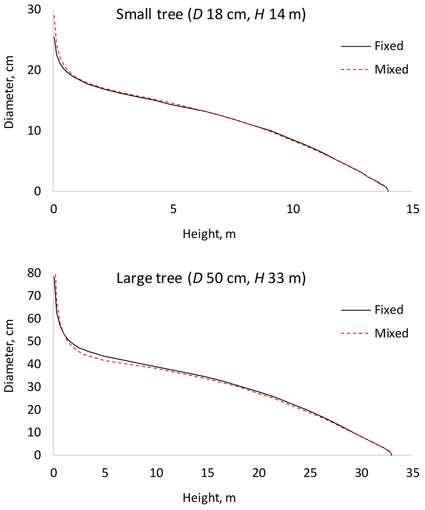
Fig. 5. Comparison of the fixed-effects model (Fixed) and fixed part of the mixed-effects model (Mixed). D is diameter at breast height; H is tree height from ground to top.
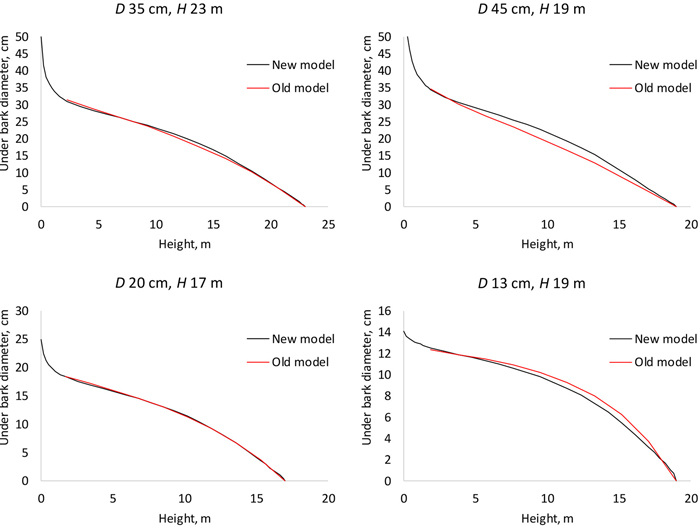
Fig. 6. Stem profiles predicted with the fixed-effects model of this study (new model) and with the model of Gjølberg 1978 (old model). D is diameter at breast height; H is tree height from ground to top.
| Table 7. Parameters of the fixed-effects bark model. | ||
| Parameter | Estimate | t value |
| a0 | 0.248 | 31.9 |
| a1 | 1.060 | 55.5 |
| a2 | –0.529 | –21.1 |
| b1 | 0.379 | 15.4 |
| b2 | 0.166 | 7.3 |
| b3 | 0.275 | 2.9 |
| b4 | –0.419 | –7.9 |
| b5 | 0.025 | 9.7 |
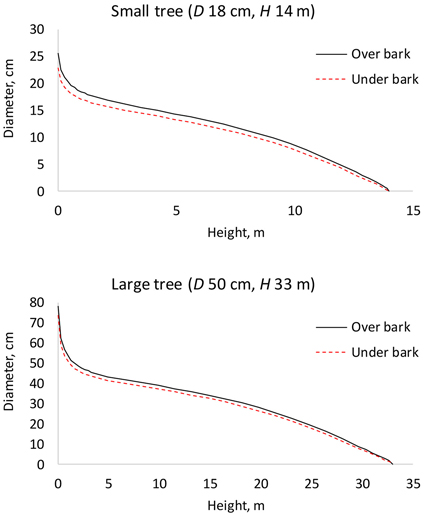
Fig. 7. Under bark diameter can be calculated by predicting bark thickness by the bark model (Table 7) and subtracting it from over bark diameter (Table 2). D is diameter at breast height; H is tree height from ground to top.