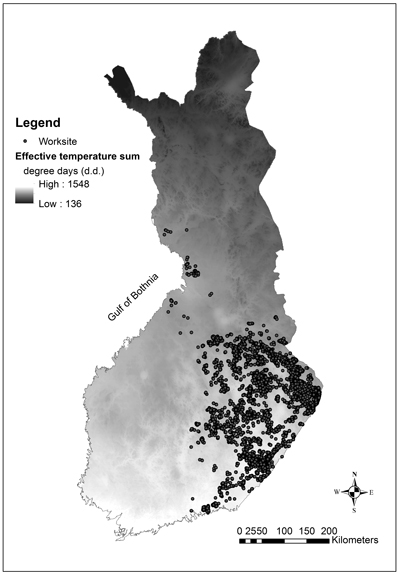
Fig. 1. Location of the study worksites in Finland. The long-term (1971–2000) average effective temperature sum is showed on the map.
| Table 1. Main categorical characteristics of the worksites (N = 11 848) extracted from forest resources data (FRD) and used in modelling. | |||||||||
| Year | Month | Site type a | Main tree species b | Soil preparation method | |||||
| 2008 | 359 | Dec–Mar | 216 | OMT | 1316 | Pinus | 3936 | Spot mounding | 4637 |
| 2009 | 454 | Apr | 522 | MT | 6812 | Picea | 6184 | Disc trenching | 2689 |
| 2010 | 737 | May | 1625 | VT | 1869 | Betula pendula | 869 | No preparation | 45 |
| 2011 | 863 | Jun | 1618 | CT or ClT | 82 | Betula pubescens | 812 | Inverting | 68 |
| 2012 | 1120 | Jul | 1304 | Rhtkg or Mtkg | 1335 | Other broadleaves | 47 | Excavator patching | 1392 |
| 2013 | 995 | Aug | 1793 | Ptkg | 397 | Continuous patching | 1380 | ||
| 2014 | 1574 | Sep | 1489 | Vtkg or Jätkg | 37 | Establishment method | Ditch mounding | 1258 | |
| 2015 | 1476 | Oct | 1967 | Planting | 9780 | Not known | 379 | ||
| 2016 | 1490 | Nov | 1314 | JSM c | Direct seeding | 1358 | |||
| 2017 | 1533 | Yes | 1418 | Natural | 710 | ||||
| 2018 | 1247 | No | 10430 | ||||||
| a Oxalis–Myrtillus type (OMT), Myrtillus type (MT), Vaccinium type (VT), Calluna type (CT), and Cladonia type (ClT) on mineral soils, and the corresponding site types on peatlands herb-rich type (Rhtkg), Myrtillus type (Mtkg), Vaccinium type (Ptkg), dwarf shrub type (Vtkg) and Cladonia type (Jätkg). b Picea includes also Larix and Abies, and Pinus includes both P. sylvestris and P. contorta as main tree species. c Juvenile stand management (JSM) has been done earlier or not. | |||||||||
| Table 2. Main continuous characteristics of the worksites (N = 11 848) used in modelling. | ||||||
| Min | Median | Mean | SD | Max | ||
| TC, h ha–1 | 0.40 | 8.80 | 9.93 | ± | 5.47 | 46.10 |
| Worksite area, ha | 0.03 | 1.34 | 1.89 | ± | 1.75 | 27.73 |
| Stand age, years | 2 | 8 | 8.40 | ± | 3.40 | 24 |
| Establishment delay a, years | 0 | 1 | 0.58 | ± | 0.59 | 9 |
| Stand age in previous JSM b, years | 1 | 7 | 6.90 | ± | 2.00 | 13 |
| Birch in final harvest, m3 ha–1 | 0 | 5 | 13.78 | ± | 0.24 | 233 |
| Topographic wetness index | 3891 | 6797 | 7263 | ± | 1872 | 21846 |
| Temperature sum, d.d. | 935 | 1147 | 1161 | ± | 98 | 1388 |
| Latitude ETRS-TM35FIN | 6699759 | 6930960 | 7331801 | |||
| Longitude ETRS-TM35FIN | 378536 | 596313 | 725856 | |||
| a Time from the soil preparation to the artificial regeneration. b Only worksites with previous juvenile stand management (JSM) (N = 1418). | ||||||
| Table 3. Worksite difficulty factors (N = 7595) determined in field-assessed worksite classification (WSC) by forestry officer or worker and used in modelling. Reference productivity guidelines for removal quantity (ha day–1), terrain difficulty (multiplier) and removal type (multiplier) classes are given in parentheses. | |||||
| Removal quantity | Terrain difficulty | Removal type | |||
| Class | N | Class | N | Class | N |
| Sparse (1.80 ha day–1) | 444 | Normal (1.00) | 5590 | Easy (1.00) | 178 |
| Easy (1.25 ha day–1) | 1657 | Difficult (0.95) | 1836 | Normal (0.95) | 7286 |
| Normal (0.67 ha day–1) | 3779 | Extreme (0.90) | 169 | Difficult (0.90) | 131 |
| Difficult (0.32 ha day–1) | 1569 | ||||
| Extreme (0.20 ha day–1) | 146 | ||||
| Table 4. Linear mixed model (Model 1, Eq. 1) for the time consumption (h ha–1) in pre-commercial thinning (PCT) based on forest resources data (N = 11 848). F-values were calculated to test the significance of the categorical variables in the model. The bias correction ratio was 1.0037. | ||||
| Variable | Estimate | Std. Error | t-value | p |
| Intercept | 2.0505 | 0.0425 | 48.2 | < 0.001 |
| JSM-program | ||||
| Stand age, (years from estab.) | 0.0614 | 0.0056 | 10.9 | < 0.001 |
| Stand age^2, years | –0.0009 | 0.0003 | –3.2 | 0.001 |
| Previous JSM (1 yes, 0 No) | 0.2625 | 0.0571 | 4.6 | < 0.001 |
| Previous JSM * Stand age | 0.0215 | 0.0074 | 2.9 | 0.004 |
| Previous JSM * Stand age in previous JSM | –0.0672 | 0.0095 | –7.1 | < 0.001 |
| ln(site area), ha | –0.0582 | 0.0044 | –13.2 | < 0.001 |
| Site type, ref MT | F = 108.0 | < 0.001 | ||
| OMT | 0.0598 | 0.0124 | 4.8 | < 0.001 |
| VT | –0.2535 | 0.0133 | –19.0 | < 0.001 |
| CT-ClT | –0.5344 | 0.0450 | –11.9 | < 0.001 |
| Rhtkg-Mtkg | 0.1731 | 0.0141 | 12.3 | < 0.001 |
| Ptkg | 0.0074 | 0.0231 | 0.3 | 0.747 |
| Vtkg-Jätkg | –0.1973 | 0.0673 | –2.9 | 0.003 |
| Month, ref Aug. | F = 83.7 | < 0.001 | ||
| Dec.-Mar. | –0.1503 | 0.0286 | –5.3 | < 0.001 |
| Apr. | –0.3440 | 0.0200 | –17.2 | < 0.001 |
| May. | –0.2876 | 0.0137 | –21.1 | < 0.001 |
| Jun. | –0.1626 | 0.0136 | –12.0 | < 0.001 |
| Jul. | –0.0494 | 0.0144 | –3.4 | < 0.001 |
| Sept. | –0.0795 | 0.0138 | –5.7 | < 0.001 |
| Oct. | –0.1457 | 0.0130 | –11.2 | < 0.001 |
| Nov. | –0.1390 | 0.0145 | –9.6 | < 0.001 |
| Ln(TWI), in tens of thousands | 0.1491 | 0.0172 | 8.7 | < 0.001 |
| Establishment method, ref planting | F = 50.4 | < 0.001 | ||
| Direct-seeding | –0.1614 | 0.0162 | –10.0 | < 0.001 |
| Natural | –0.0842 | 0.0182 | –4.6 | < 0.001 |
| Establishment dealy, years | 0.0388 | 0.0068 | 5.7 | < 0.001 |
| Site preparation, ref spot mounding | F = 14.4 | < 0.001 | ||
| Disc trenching | –0.0596 | 0.0131 | –4.6 | < 0.001 |
| No soil preparation | –0.2030 | 0.0593 | –3.4 | < 0.001 |
| Inverting | 0.0345 | 0.0514 | 0.7 | 0.502 |
| Excavator patching | –0.0032 | 0.0140 | –0.2 | 0.821 |
| Continuous patching | –0.0512 | 0.0146 | –3.5 | < 0.001 |
| Ditch mounding | 0.1083 | 0.0151 | 7.2 | < 0.001 |
| Not known | –0.0384 | 0.0241 | –1.6 | 0.112 |
| Main species, ref Picea | F = 13.2 | < 0.001 | ||
| Pinus | –0.0504 | 0.0096 | –5.3 | < 0.001 |
| Betula pendula | 0.0335 | 0.0148 | 2.3 | 0.024 |
| Betula pubescens | 0.0349 | 0.0154 | 2.3 | 0.023 |
| Other broadleaf | 0.0829 | 0.0579 | 1.4 | 0.152 |
| Random effects at: | Variance | |||
| Forest worker level (N = 163) | 0.0848 | |||
| Year level (N = 11) | 0.0047 | |||
| Stand level (N = 11 848) | 0.1506 | |||
| a JSM = juvenile stand management, TWI = topographic wetness index, TS = effective temperature sum. | ||||
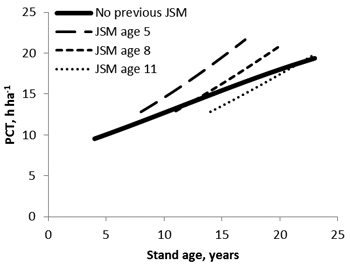
Fig. 2. Effect of stand age and the previous juvenile stand management (JSM) on the time consumption (TC) in pre-commercial thinning (PCT) done in August in planted spruce stand on spot mounded MT site type. Other predictor values fixed to: establishment delay = 0, TWI = 10 000, area = 1.5 ha.
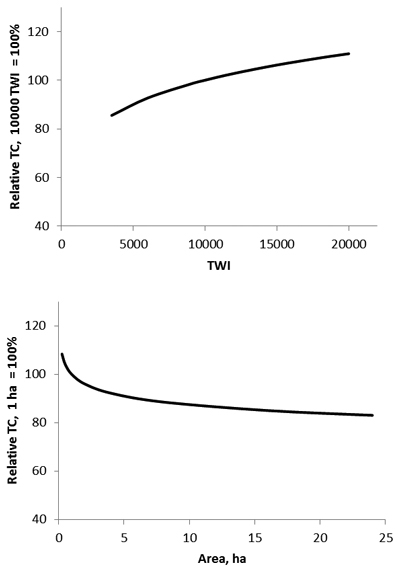
Fig. 3. Relative time consumptions (TC) for PCT as functions of the size of worksite area (1 ha = 100) and topographic wetness index (TWI 10 000 = 100).
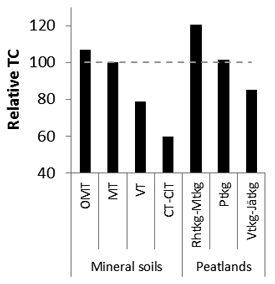
Fig. 4. Relative time consumption (TC) in PCT on different site types (MT = 100).
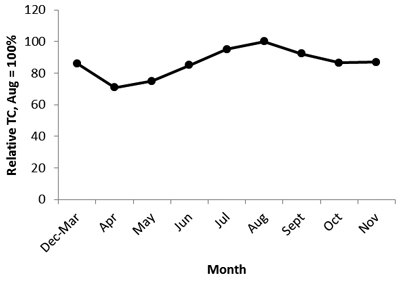
Fig. 5. The effect of the seasonal timing of PCT on the relative time consumption (TC) for PCT (August = 100).
| Table 5. Fitting statistics of three models for the time consumption in PCT. Fitting statistics were based on back-transformed predictions. In the modelling data sets, the models were unbiased due to Snowdon’s bias correction. | ||||
| Model 1 (FRD) | WSC-comparison | |||
| Modelling data set | Validation data set | Model 2 (WSC) | Model 3 (FRD) | |
| No. of worksites | 11 848 | 3035 | 7595 | 7595 |
| Bias, h ha–1 | 0 | –0.16 | 0 | 0 |
| Bias%, % | 0 | –1.6 | 0 | 0 |
| RMSE, h ha–1 | 4.89 | 4.75 | 4.11 | 4.91 |
| RMSE%, % | 49.3 | 48.9 | 43.2 | 51.6 |
| R2, % | 19.9 | 19.3 | 43.0 | 18.6 |
| Models 1 and 3 were fitted by using variables such as site and stand characteristics and previous silvicultural management available in forest resources data (FRD), whereas Model 2 was based on field-assessed worksite classification (WSC). | ||||
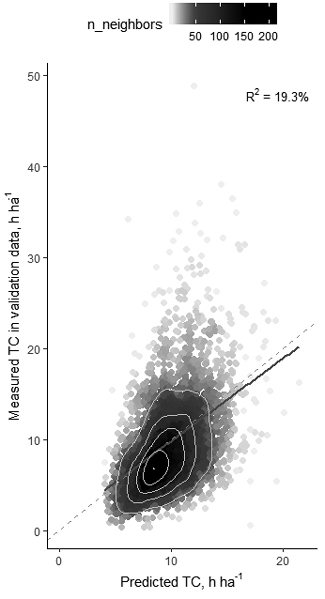
Fig. 6. Measured time consumption (TC) in PCT in validation data compared to forest resource data (FRD) based predictions (Model 1). Solid grey line is the regression line between the variables, dashed grey line is the diagonal where measured and predicted values are equal. The density of plots is illustrated with a density index as numbers of near neighbors (n_neighbors) and density based contours are marked with light grey contour lines each representing 20% share of the worksites, the outermost contour includes 80% of the observations.
| Table 6. Linear mixed model (Model 2, Eq. 1) for the time consumption (h ha–1) in PCT based on worksite difficulty classification (N = 7595). F-values were calculated to test the significance of the categorical variables in the model. The bias correction ratio was 0.98302. | ||||
| Value | Std.Error | t-value | p | |
| Intercept | 1.2410 | 0.0480 | 25.8 | <0.001 |
| Removal quantity class, ref Sparse | F = 2055.4 | <0.001 | ||
| Easy | 0.3574 | 0.0183 | 19.5 | <0.001 |
| Normal | 0.8298 | 0.0175 | 47.4 | <0.001 |
| Difficult | 1.2944 | 0.0190 | 68.2 | <0.001 |
| Extreme | 1.5388 | 0.0330 | 46.6 | <0.001 |
| Terrain difficulty class, ref Normal | F = 70.2 | <0.001 | ||
| Difficult | 0.1018 | 0.0101 | 10.1 | <0.001 |
| Extreme | 0.2202 | 0.0272 | 8.1 | <0.001 |
| Removal type class, ref Easy | F = 15.9 | <0.001 | ||
| Normal | 0.1396 | 0.0268 | 5.2 | <0.001 |
| Difficult | 0.1946 | 0.0399 | 4.9 | <0.001 |
| Random effects at: | Variance | |||
| Forest worker level (N = 100) | 0.1202 | |||
| Year level (N = 5) | 0.0006 | |||
| Worksite level (N = 7595) | 0.1089 | |||