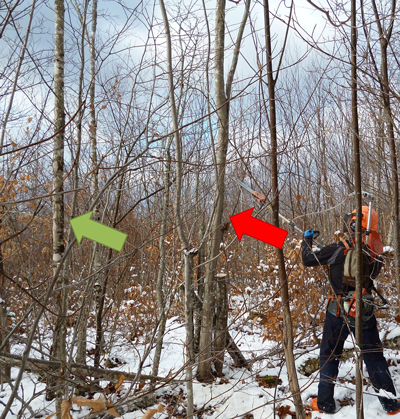
Fig. 1. Worker performing precommercial crop tree release (PCTR) with the Husqvarna 535FBx spacing saw in the study stand. Green arrow points to a maple crop tree while red arrow points to a beech competitor about to be cut.
| Table 1. Variants of work methods observed during the precommercial crop tree release (PCTR) trial. | ||
| Variant | Description | Duration |
| Paint and GPS | PCTR + Paint marks by the worker on crop trees to help navigate the stand + GPS waypoint of each crop tree | Days 1–6 of the trial |
| GPS only | PCTR + GPS waypoint of each crop tree | Day 7, 9, 11 and 13 |
| PCTR only | PCTR + GPS used for navigation purpose only | Day 8, 10 and 12 |
| Table 2. Definition of work cycle elements in time and motion study of the PCTR trial. | ||
| Cycle element | Description | Included in element |
| Cutting | Time required to release crop trees | When the chain is running or when working to bring trees down. This inevitably includes some movements of the worker and some time looking up to evaluate the presence of competing trees, especially when two crop trees are near one another. Cutting commonly ended when the worker stopped to either take out the GPS or the Paint container or, yelled “done” in the scenario without GPS. Small delays such as time taken to push on a tree that pinched the sawblade was included in this element. |
| Moving | Time required to search for crop trees, move between crop trees and evaluate the presence of competing trees | When the worker is walking, looking up and down at potential crop trees, but without the chain running on the saw or performing other tasks. Commonly started when the GPS or Paint container was put back in its holster. This element included limited saw use to cut small stems when the worker was walking through thick brush with no crop tree around. |
| GPS | Time dedicated to manipulating the GPS for entering crop tree waypoints | After releasing a crop tree, when worker had the GPS in hand and was not walking. The manipulation for waypoints was called out loud by the worker to distinguish from GPS manipulation for navigation purposes. This served as the end of cycle. |
| Paint | Time dedicated to marking crop trees with paint | When the worker had the paint container in hand. From the time it was taken out of the holster, until it was back in the holster. |
| Delays | Time resting or mechanical delays | When engine was turned off. Not considered as productive work time. |
| Table 3. Summary of worker’s productivity in PCTR of a young hardwood stand in New Brunswick. For detailed data see Soucy and Béland (2018). | ||||||
| Average | ||||||
| Variant | Total productive time (h) | Crop trees released per hour | Area treated (ha h–1) (based on GPS buffer) | Area treated (ha h–1) (based on corridor area) | Crop trees ha–1 (based on GPS buffer) | Crop trees ha–1 (based on corridor area) |
| Paint and GPS | 35.3 | 47.1 | 0.16 | 0.22 | 297 | 211 |
| GPS only | 15.3 | 71.9 | 0.18 | 0.31 | 387 | 233 |
| PCTR only | 13.3 | 76.2 | 0.29 | 0.48 | 269 | 163 |
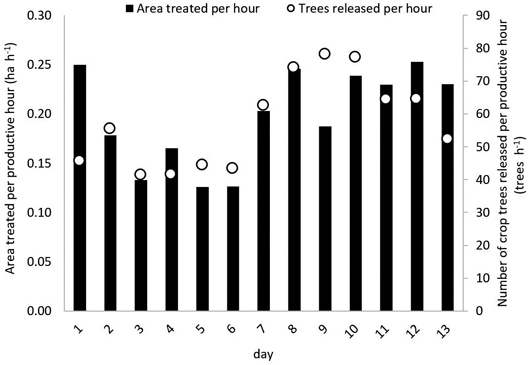
Fig. 2. Daily productivity of PCTR of a young hardwood stand observed in terms of area treated per productive hour (GPS based) and in terms of the number of crop trees released per productive hour.
| Table 4. Synthesis of time and motion measurements in PCTR of a young hardwood stand in New Brunswick. | ||||||||
| Average | ||||||||
| Variant | Duration (productive hours only) | Number of crop trees (CT) released | Trees cut per crop tree | Duration per crop tree (s) | Moving (s CT–1) | Cutting (s CT–1) | GPS (s CT–1) | Paint (s CT–1) |
| Paint & GPS | 19.07 | 954 | 6.1 | 72.0 | 20.6 | 43.9 | 3.9 | 3.5 |
| GPS only | 1.48 | 82 | 7.7 | 65.1 | 22.4 | 38.7 | 4.1 | - |
| PCTR only | 11.93 | 894 | 5.6 | 48.0 | 16.0 | 32.0 | - | - |
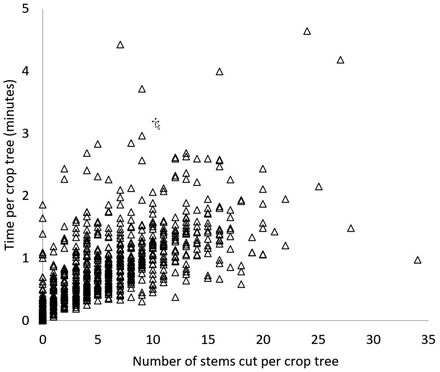
Fig. 3. Time consumption per crop tree in the PCTR only variant (Pearson correlation coefficient r = 0.6772).
| Table 5. Estimated cost of PCTR of a young hardwood stand for the worker and equipment in New Brunswick. | ||||
| Variant | 1Cost of walking and selecting trees (€ ha–1) | Cost of work on a crop tree (€) | Total cost per tree released | Total cost per area (€ ha–1) |
| Paint and GPS | 35.17 | 0.42 | 0.58 | 122.87 |
| GPS only | 30.51 | 0.25 | 0.38 | 88.83 |
| PCTR only | 17.29 | 0.24 | 0.36 | 58.41 |
| 1 Based on treated corridor area. | ||||