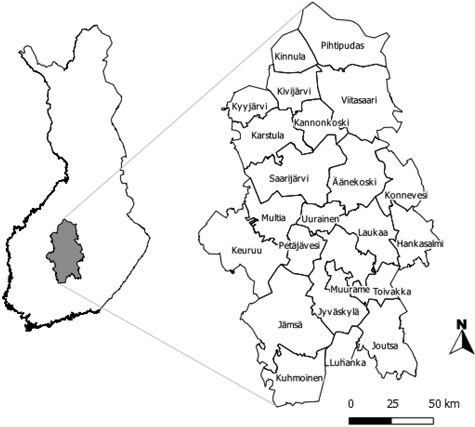
Fig. 1. Location of the region of Central Finland and the municipalities in the area (on the map to the right); (Digital map data: © National Land Survey of Finland MML/VIR/MYY/328/08).
| Table 1. Sources of the map data used in the study. | |
| Map data | Reference/Source |
| Raster map of forest biomass variables | Tuominen et al. (2010) |
| Thematic maps of forest attributes | MS-NFI of Finland (see Tomppo et al. 2012) |
| Municipality boundaries | National Land Survey of Finland (NLS) |
| National conservation areas + Natura2000 areas | Finnish Environmental Institute |
| Digital Elevation model, 25m | National Land Survey of Finland (NLS) (see Elevation model 25 m 2013) |
| Road data | MS-NFI of Finland (see Tomppo et al. 2012) |
| Table 2. Number of observations (n), mean values for the basal area (G, m2/ha), the basal area weighted mean diameter at breast height (Dg, cm) and the stand age (Age, years) in the stump recovery study materials for Scots pine stands, Norway spruce stands and mixed stands of Scots pine and Norway spruce. | ||||
| Study material | Variable | Scots pine | Norway spruce | Mixed |
| SPATI | n | 13 | 25 | 25 |
| Dg | 29.6 | 30.6 | 27.5 | |
| G | 22.9 | 25.6 | 31.9 | |
| Age | 95.5 | 60.7 | 68.1 | |
| ENSO | n | 7 | 1 | 19 |
| Dg | 29.6 | 27.9 | 27.3 | |
| G | 17.2 | 28.9 | 25.9 | |
| Age | 91.7 | 84 | 85.8 | |
| KYMI | n | 11 | 12 | 33 |
| Dg | 28.3 | 27.8 | 27.5 | |
| G | 19.12 | 22.8 | 23.1 | |
| Age | 99.7 | 87.7 | 94.5 | |
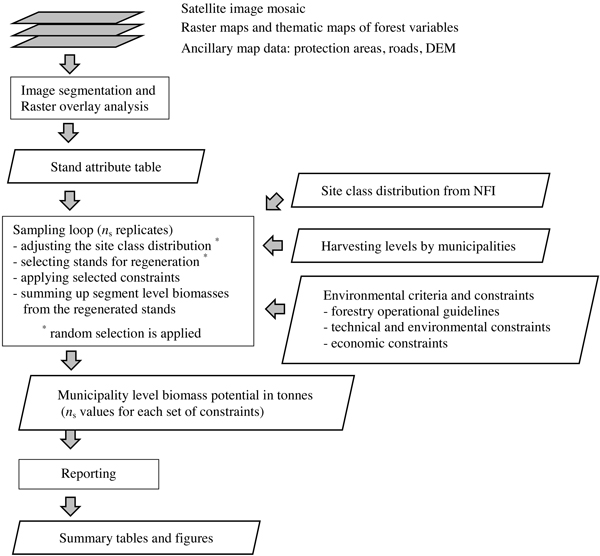
Fig. 2. Framework of the system for calculating the potential of forest chips.
| Table 3. Stand variables calculated at the segment level and the sources of the data. Biomass is expressed using dry weight (tonnes/ha). | ||
| Attribute | Unit/Values | Source |
| Mean height | dm | * |
| Mean diameter at breast height | cm | * |
| Site fertility class | 1:‘Fertile’,…, 7:’Very poor’ | * |
| Basal area | m²/ha | * |
| Total volume | m3/ha | ** |
| Stem volume, Scots pine | m3/ha | ** |
| Stem volume, Norway spruce | m3/ha | ** |
| Stem volume, deciduous tree species | m3/ha | ** |
| Dominating tree species, (by total volume) | “pine”, “spruce”, “birch” | |
| Stem biomass, Scots pine | t/ha | ** |
| Stem biomass, Norway spruce | t/ha | ** |
| Stem biomass, deciduous tree species | t/ha | ** |
| Biomass of living branches, Scots pine | t/ha | ** |
| Biomass of living branches, Norway spruce | t/ha | ** |
| Biomass of living branches, deciduous tree species | t/ha | ** |
| Biomass of needles, Scots pine | t/ha | ** |
| Biomass of needles, Norway spruce | t/ha | ** |
| Biomass of foliage, deciduous tree species | t/ha | ** |
| Belowground biomass, Scots pine | t/ha | ** |
| Belowground biomass, Norway spruce | t/ha | ** |
| Belowground biomass, deciduous tree species | t/ha | ** |
| Source: * MS-NFI (see, for example, Tomppo et. al 2012); ** Tuominen et al. (2010) | ||
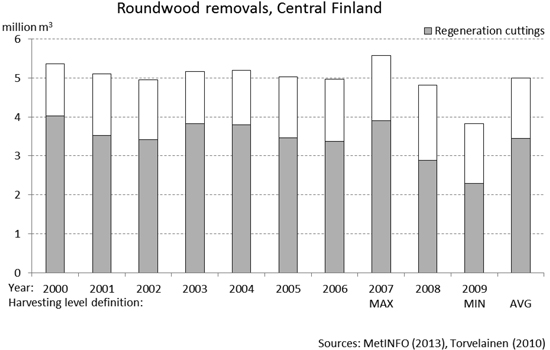
Fig. 3. Roundwood removals and the harvesting level definitions for the annual final fellings in Central Finland.
| Table 4. Summary statistics for the stump recovery values in the study materials by stand categories, (SD = standard deviation, n = number of stands). | ||||||
| Stand category | Data set | n | mean | SD | min | max |
| Pine stands | SPATI | 13 | 0.89 | 0.041 | 0.82 | 0.95 |
| ENSO | 7 | 0.86 | 0.12 | 0.60 | 0.95 | |
| KYMI | 11 | 0.91 | 0.032 | 0.86 | 0.95 | |
| Spruce stands | SPATI | 25 | 0.88 | 0.044 | 0.78 | 0.96 |
| ENSO | 1 | 0.93 | - | 0.93 | 0.93 | |
| KYMI | 12 | 0.93 | 0.02 | 0.88 | 0.95 | |
| Mixed stands | SPATI | 25 | 0.87 | 0.051 | 0.78 | 0.94 |
| ENSO | 19 | 0.89 | 0.032 | 0.82 | 0.94 | |
| KYMI | 33 | 0.91 | 0.034 | 0.84 | 0.97 | |
| Table 5. Constraints applied in the calculation system to account for the technical, economic and environmental protection criteria. | |
| Constraint | Value or measure |
| Basic constraints (I) | |
| Net annual increment | Harvesting levels in scenarios are below the net annual increment level in Central Finland, (see, for example, MetINFO (2013)) |
| Technical accessibility | |
| – recovery rate for logging residues | 70%, (Äijälä et. al 2010) |
| – recovery rate for stump extraction | 90%, (see section 3.4) |
| – the proportion of unmerchantable stem top | Scots pine: 4%, Norway spruce: 5%, (Hakkila et al. 2004); broadleaved tree species: 17% (for Southern Finland, see Peltola and Ihalainen 2010, p. 72) |
| – steepness of slope | steepness ≤ 20 degrees, (Ponsse 2012) |
| Economic accessibility | |
| – minimum recovery volume for logging residues | 20 m3/ha and 40 m3/stand |
| – minimum recovery volume for stumps | 100 m3/stand |
| – minimum area for stump harvesting | 2 ha |
| Protection of forest soil | |
| – recovery of logging residues and stumps | Only from fertile stands, i.e. feasible site fertility classes: 1–4 (Äijälä et al. 2010) |
| Protection of water and remaining trees | A buffer zone of 3 m at stump harvesting sites (Äijälä et al. 2010) |
| Optional constraints (II and III) | |
| – maximum actual forwarding distance (II) | 300 metres, (Uotila and Viitala 2000) |
| – dominating tree species in regeneration stands for stump extraction (III) | Norway spruce |
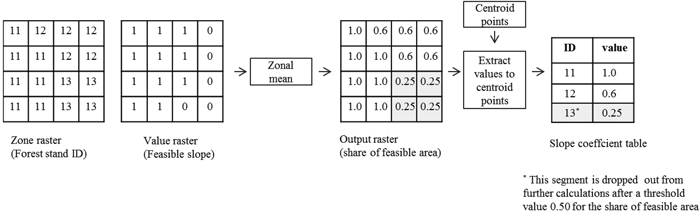
Fig. 4. Calculation of the slope coefficient for the segments was based on raster overlay analyses using a 20 metre grid cell: the “Feasible slope” is a DEM-based, logical raster layer indicating whether the steepness of the slope is less or equal to 20 degrees (1:TRUE; 0: FALSE).
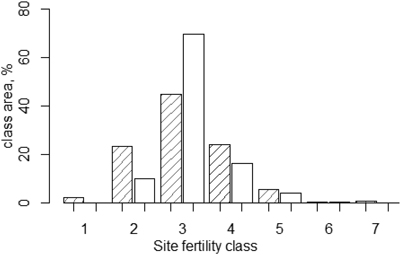
Fig. 5. Adjusting the site class distribution in the stand attribute table (bars without a line pattern) was based on a distribution adapted from Peltola and Ihalainen (2010), (bars with a line pattern).
| Table 6. Basic densities (r0g) and lower heating values of dry matter (Qnet,d) for the different biomass types. | ||
| Biomass type | r0g, (t/m3) | Qnetd, (MJ/kg) |
| Logging residues, Scots pine 1) | 0.395 a) | 20.5 c) |
| Logging residues, Norway spruce 2) | 0.465 a) | 19.7 c) |
| Logging residues, broadleaved 2) | 0.500 a) | 19.7 c) |
| Stumps, Scots pine | 0.475 a) | 19.5 c) |
| Stumps, Norway spruce | 0.435 a) | 19.1 c) |
| Stumps, broadleaved | 0.450 b) | 18.5 d) |
| Notes: 1) With needles; 2) Without needles or foliage. Sources: a) Alakangas (2000), p. 45; b) estimated based on the study by Kärkkäinen (2007), p. 156; c) Alakangas (2000), p. 44; d) p. 67. | ||
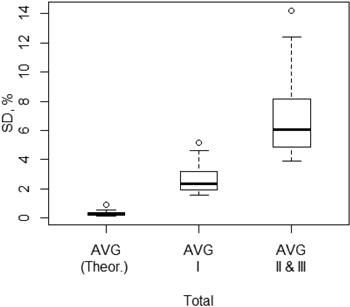
Fig. 6. Coefficient of variation (SD, %) within municipalities in the set of replicates (ns = 500) for the theoretical potential (Theor.) and for the technical potentials of forest chips from final fellings in Central Finland in the harvesting level AVG under different sets of constraints; (I: basic constraints; II: basic constraints and an actual forwarding distance limit of 300 m; III: basic constraints and a stump extraction limit to regeneration stands dominated by Norway spruce). (In the boxplot, the box region shows the range between 1st and 3rd quartiles (including 50% of the observations), the thick line is the median and the outer lines extend to the most extreme data point which is no more than 1.5 times the length of the box away from the box. The most extreme observations are also plotted (R Core Team 2012)).
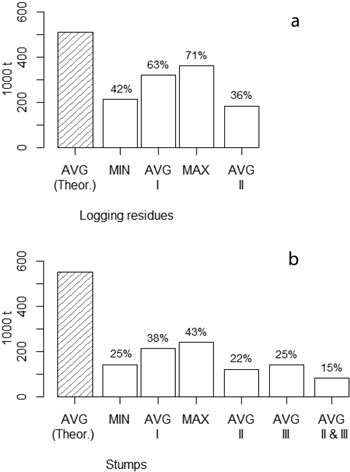
Fig. 7. Theoretical potential (Theor.) and the technical potentials in Central Finland for logging residues (a) and stumps (b) from final fellings in the harvesting levels MIN, AVG and MAX under different sets of constraints (I: basic constraints; II: basic constraints and an actual forwarding distance limit of 300 m; III: basic constraints and a stump extraction limit to regeneration stands dominated by Norway spruce). At the top of each bar there is the percentage that the bar represents of the theoretical potential.
| Table 7. Potential of forest chips from final fellings by municipality (1000 tonnes dry mass), applying all basic and optional constraints; the harvesting level AVG is assumed (Residue = logging residues; Stump = stumps and roots; pine = Pinus sylvestris L.; spruce = Picea abies (L.) Karst.; broadl. = broadleaved tree species (mainly Betula pendula, B.pubescens, Alnus incana, Populus tremula)). Total % value is relative to the theoretical potential. | ||||||||||
| Municipality | Residue | Stump | Residue | Stump | Total | Total % | ||||
| pine | spruce | broadl. | pine | spruce | broadl. | All | All | |||
| Hankasalmi | 1.6 | 6.5 | 1.5 | 1.1 | 3.6 | 0.7 | 9.6 | 5.5 | 15.1 | 31.5 |
| Joutsa | 3.2 | 6.7 | 2.5 | 1.1 | 2.5 | 0.7 | 12.4 | 4.3 | 16.6 | 24.1 |
| Jyväskylä | 3.7 | 10.0 | 2.8 | 2.4 | 5.5 | 1.3 | 16.6 | 9.2 | 25.8 | 29.1 |
| Jämsä | 4.6 | 10.9 | 3.1 | 2.8 | 5.9 | 1.4 | 18.6 | 10.1 | 28.7 | 28.1 |
| Kannonkoski | 1.4 | 2.3 | 0.6 | 0.5 | 0.9 | 0.2 | 4.4 | 1.5 | 5.9 | 20.8 |
| Karstula | 2.3 | 3.1 | 1.0 | 0.6 | 1.2 | 0.2 | 6.3 | 2.0 | 8.3 | 18.7 |
| Keuruu | 4.7 | 7.7 | 2.1 | 1.4 | 2.8 | 0.5 | 14.6 | 4.6 | 19.2 | 24.1 |
| Kinnula | 0.8 | 1.0 | 0.3 | 0.2 | 0.4 | 0.1 | 2.1 | 0.7 | 2.8 | 17.9 |
| Kivijärvi | 1.3 | 1.9 | 0.6 | 0.3 | 0.6 | 0.1 | 3.8 | 1.0 | 4.8 | 18.9 |
| Konnevesi | 1.3 | 4.8 | 1.2 | 0.9 | 2.6 | 0.6 | 7.2 | 4.0 | 11.2 | 27.5 |
| Kuhmoinen | 2.6 | 6.5 | 1.7 | 1.6 | 3.4 | 0.8 | 10.8 | 5.8 | 16.6 | 28.3 |
| Kyyjärvi | 0.8 | 0.6 | 0.2 | 0.0 | 0.1 | 0.0 | 1.6 | 0.2 | 1.8 | 10.9 |
| Laukaa | 2.0 | 5.4 | 1.4 | 1.2 | 2.9 | 0.6 | 8.9 | 4.7 | 13.6 | 27.8 |
| Luhanka | 0.5 | 1.3 | 0.4 | 0.2 | 0.6 | 0.2 | 2.2 | 1.0 | 3.2 | 20.8 |
| Multia | 1.8 | 3.4 | 0.8 | 0.8 | 1.6 | 0.2 | 6.0 | 2.6 | 8.6 | 24.9 |
| Muurame | 0.4 | 1.1 | 0.3 | 0.3 | 0.6 | 0.1 | 1.7 | 1.0 | 2.8 | 28.9 |
| Petäjävesi | 1.7 | 3.9 | 1.0 | 0.9 | 2.0 | 0.4 | 6.6 | 3.2 | 9.8 | 30.2 |
| Pihtipudas | 2.8 | 3.9 | 1.2 | 0.7 | 1.3 | 0.2 | 7.9 | 2.2 | 10.1 | 19.8 |
| Saarijärvi | 3.2 | 5.7 | 1.5 | 1.2 | 2.6 | 0.5 | 10.4 | 4.3 | 14.7 | 21.5 |
| Toivakka | 1.2 | 2.5 | 0.9 | 0.4 | 0.9 | 0.3 | 4.6 | 1.6 | 6.2 | 23.5 |
| Uurainen | 0.9 | 2.1 | 0.5 | 0.4 | 1.0 | 0.2 | 3.6 | 1.5 | 5.1 | 23.3 |
| Viitasaari | 4.2 | 7.0 | 1.9 | 1.3 | 2.5 | 0.5 | 13.1 | 4.3 | 17.4 | 23.1 |
| Äänekoski | 2.4 | 6.4 | 1.5 | 1.3 | 3.3 | 0.7 | 10.3 | 5.3 | 15.6 | 25.9 |
| SUM | 49.5 | 104.6 | 29.1 | 21.5 | 48.8 | 10.4 | 183.2 | 80.8 | 264.0 | 24.9 |
| kg/ha a) | 35.7 | 75.4 | 21.0 | 15.5 | 35.2 | 7.5 | 132.0 | 58.2 | 190.2 | – |
| a) kg dry mass; Area of forest land in Central Finland: 1 388 000 ha (Peltola and Ihalainen 2012). | ||||||||||