| Table 1. Stand parameters for uneven-aged and even-aged stand (light and medium thinning) in spring 2003. | |||||||||
| Stand type | Start of experiment | Area, ha | Stand age, years | Number of trees ha–1 > 2.5 cm DBH | Site index, H40 | Standing volume, m3 ha–1 | Basal area, m2 ha–1 | Diameter (Dg), cm | Dominant height, m |
| Uneven-aged | 1923 | 1.0 | - | 1266 | 20.2 a) | 222 | 23.0 | 15.3 | 27.9 |
| Even-aged light thinning | 1951 | 0.101 | 81 | 1043 | 21.0 b) | 710 | 55.9 | 26.1 | 28.1 |
| Even-aged medium thinning | 1951 | 0.065 | 81 | 1120 | 20.1 b) | 649 | 51.0 | 23.6 | 27.4 |
| a) Site index estimated by vegetation type (Nilsen and Larsson 1992). b) Site index by dominant height at age 40 years in breast height (Tveite 1977). | |||||||||
| Table 2. Total biomass in standing trees and distributed on different tree compartments and C in tree biomass and ground vegetation (Mg ha–1) in the experimental stands in 2003. | |||||||||||
| Experiment | Biomass | ||||||||||
| Sum total biomass | Stem wood | Stem bark | Living branches | Dead branches | Stump | Coarse roots | Fine roots | C in tree biomass | C in ground vegetation | ||
| Uneven-aged | 155 | 79 | 8 | 35 | 0.016 | 9 | 17 | 7 | 76 | 0.39 | |
| Even-aged light thinning | 450 | 266 | 21 | 74 | 0.013 | 23 | 49 | 15 | 220 | 0.70 | |
| Even-aged medium thinning | 407 | 211 | 19 | 68 | 0.013 | 21 | 44 | 15 | 199 | 0.52 | |
| Table 3. Mean annual harvest of stem volume (including natural mortality) in an 81 year period in uneven-aged stand and mean annual increment (81 year period) in even-aged stand, total C accumulation in tree biomass, current stem volume increment and current C-accumulation in all tree parts (incl. roots < 5 cm). | ||||
| Experiment | Mean annual increment/harvest, m3 ha–1 a–1 | Total C accumulation in trees (81 year period), Mg ha–1 | Current stem volume increment, m3 ha–1 a–1 | Current C accumulation, kg ha–1 a–1 |
| Uneven-aged | 10.0 | 225 | 11.3 | 4130 |
| Even-aged light thinning | 11.0 | 276 | 23.0 | 5590 |
| Even-aged medium thinning | 10.0 | 248 | 24.2 | 5270 |
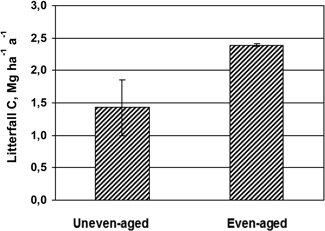
Fig. 1. Mean values and standard deviation (vertical bars) of C in litterfall during one year in the uneven-aged (n = 4) and even-aged stands (n = 2).
| Table 4. O-horizon thickness (cm) and C stocks (Mg ha–1) in humus and mineral soil layers down to 1 m depth in the different treatments, standard deviation in brackets. | ||||
| Exp. plot | O-horizon | C Mg ha–1 | ||
| Thickness, cm | O-horizon | Mineral (30 cm) | O and mineral (100 cm) | |
| Uneven-aged | 8.30 (2.47) | 53.7 (8.3) | 103.2 (30.5) | 198.8 (50.4) |
| Even-aged | 7.25 (2.26) | 43.6 (4.8) | 100.8 (15.9) | 178.1 (16.0) |
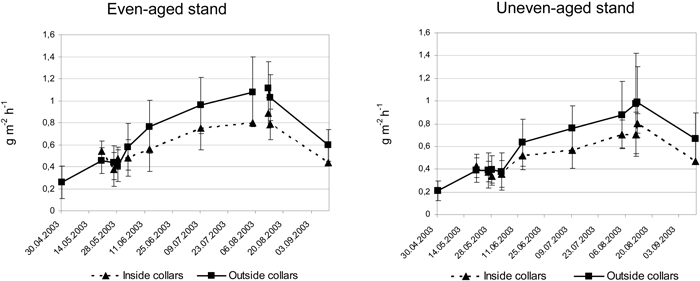
Fig. 2. Average CO2 efflux in g m–2 h–1 and standard deviation at different occasions during the growing season 2003 inside and outside collars in the uneven-aged and even-aged stands.