| Table 1. Treatments and amount of nutrients applied in the treatments. | |||||||
| Treatment | Nutrients kg ha–1 | ||||||
| N | P | K | Ca | Mg | B | Zn | |
| Control | 0 | 0 | 0 | 0 | 0 | 0 | 0 |
| Granulated ash | 0 | 73 | 190 | 836 | 134 | 1.6 | 18 |
| Loose ash | 0 | 82 | 202 | 969 | 155 | 1.6 | 22 |
| PK fertiliser | 0 | 45 | 80 | 110 | 0 | 1.5 | 0 |
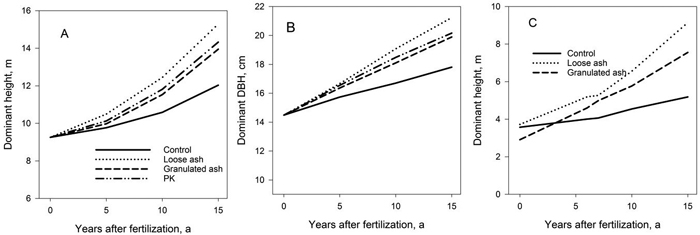
Fig. 1. Dominant height (A) and DBH (B) at Kannus experiment and dominant height at Sievi experiment (C). View larger in new window/tab.
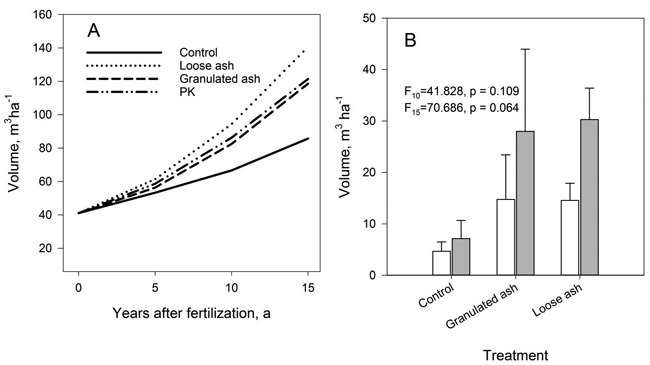
Fig. 2. Development of stand volume (A) in the Kannus and in the Sievi experiment (B) at time points 10 and 15 years after fertilisation. Bars show standard deviation.
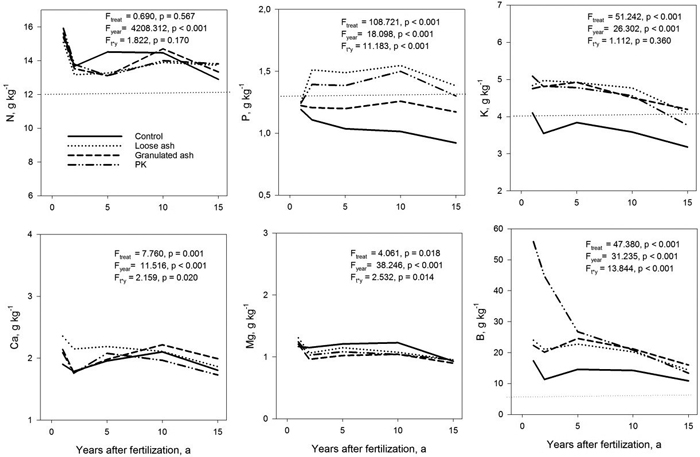
Fig. 3. Foliar nutrient concentrations at Kannus experiment. Dotted horizontal straight lines indicate deficiency limits for N, P, K and B (Paarlahti et al. 1971; Reinikainen et al. 1998). F and p values for treatment (Ftreat), year (Fyear) and treatment and year interaction (Ft*y) shown in the figures. View larger in new window/tab.
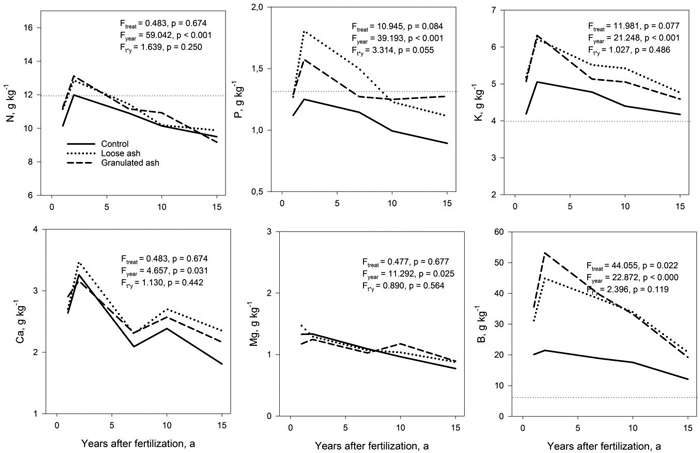
Fig. 4. Foliar nutrient concentrations in the Sievi experiment. Dotted horizontal straight lines indicate deficiency limits for N, P, K and B (Paarlahti et al. 1971; Reinikainen et al. 1998). F and p values for treatment (Ftreat), year (Fyear) and treatment and year interaction (Ft*y) shown in the figures. View larger in new window/tab.