| Table 1. Stand characteristics on the permanent study areas (PSA) in the Kola peninsula. | |||||||||
| PSA number | PSA size, ha | PSA coordinates | Species | Age, years | DBH, cm | Н, m | N, ind. ha–1 | S, m2 ha–1 | V, m3 ha–1 |
| Green moss-lichen type | |||||||||
| 1 (75) | 0.10 | 67°51´N, 31°23´E | P | 70 | 11.9 | 11.5 | 1156 | 12.9 | 74.2 |
| B | no data | 7.9 | 7.7 | 478 | 2.3 | 8.9 | |||
| 2 (90) | 0.20 | 67°51´N, 31°23´E | P | 81 | 17.6 | 15.0 | 420 | 10.2 | 76.5 |
| B | no data | 4.5 | 3.6 | 32 | 0.05 | 0.1 | |||
| 3 (91) | 0.10 | 67°51´N, 31°25´E | P | 69 | 15.9 | 12.0 | 655 | 13.1 | 78.6 |
| B | no data | 7.7 | 8.2 | 273 | 1.3 | 5.3 | |||
| Mean value | P | 74 | 15.1 | 12.8 | 744 | 12.1 | 76.4 | ||
| B | no data | 6.7 | 6.5 | 261 | 1.2 | 3.9 | |||
| Green moss type | |||||||||
| 4 (93) | 0.20 | 67°49´N, 31°19´E | P | 69 | 10.9 | 10.5 | 3100 | 29.0 | 152.3 |
| B | no data | 5.3 | 6.1 | 120 | 0.26 | 0.8 | |||
| 5 (94) | 0.10 | 67°49´N, 31°19´E | P | 70 | 14.5 | 14.6 | 1480 | 24.6 | 179.6 |
| B | no data | 6.1 | 8.4 | 140 | 0.41 | 1.7 | |||
| 6 (99) | 0.20 | 67°49´N, 33°19´E | P | 75 | 15.0 | 14.2 | 1420 | 25.1 | 178.2 |
| B | no data | 7.3 | 7.9 | 320 | 1.3 | 5.1 | |||
| Mean value | P | 71 | 13.5 | 13.1 | 2000 | 26.3 | 172.3 | ||
| B | no data | 6.2 | 7.5 | 193 | 0.66 | 2.5 | |||
| P – Scots pine; B – pubescent birch; H – height; N – number of individuals; S – basal area; V – volume. | |||||||||
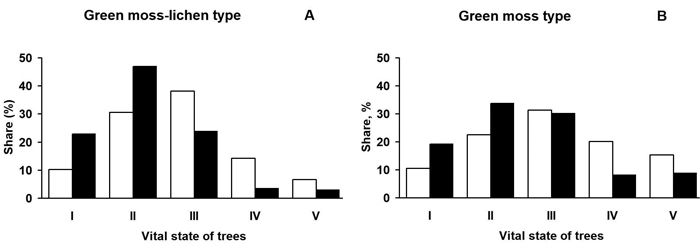
Fig. 1. The vitality distribution of Scots pine trees in the studied communities in the Kola peninsula. White bars – by the number of individuals, black bars – by volume. I – non-oppressed (healthy) trees; II – moderately oppressed
(moderately weakened) trees; III – strongly oppressed (strongly weakened) trees; IV – dying trees; V – dry trees.
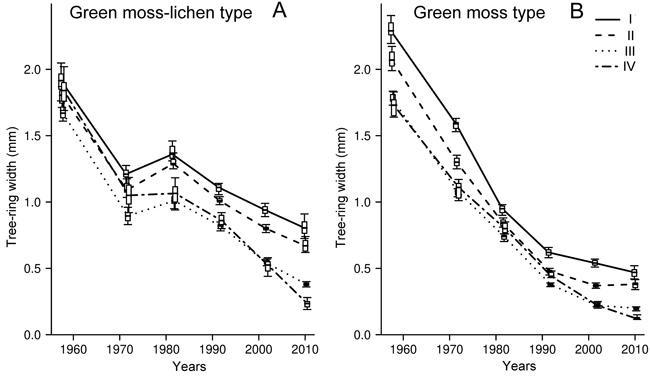
Fig. 2. Dynamics of radial increment (mm year–1) in Scots pine trees of differing-vitality state (I–IV) in green moss-lichen (A) and green moss site type (B) pine forest in the Kola peninsula. I – non-oppressed (healthy) trees; II – moderately oppressed (moderately weakened) trees; III – strongly oppressed (strongly weakened) trees; IV – dying trees. A horizontal line is the median; a box is the interval between 17th and 83th percentiles; whiskers represent the interval from 2.5th to 97.5th percentiles.
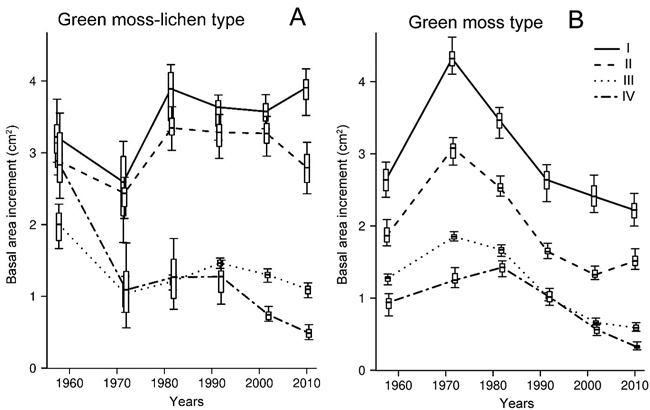
Fig. 3. Dynamics of basal area increment (cm2 year–1) in Scots pine trees of differing-vitality state (I–IV) in green moss-lichen (A) and green moss site type (B) pine forest in the Kola peninsula. I – non-oppressed (healthy) trees; II – moderately oppressed (moderately weakened) trees; III – strongly oppressed (strongly weakened) trees; IV – dying trees. A horizontal line is the median; a box is the interval between 17th and 83th percentiles; whiskers represent the interval from 2.5th to 97.5th percentiles.