| Table 1. Basic information on the afforestation experiments (Exp-N and Exp-S) of Scots pine on cutaway peatlands. Timing of treatments: month/year. | |||
| Treatment /Experiment | Exp-N | Exp-S | Comment |
| Ditching and mounding | 10/1986 | 10/1987 | |
| Ditch spacing | 15 and 40 m | 40 m | |
| Planting | 6/1987 | 5/1988 | density 2500 seedlings/ha |
| Seeding | 5/1987 | 5/1988 | density 2500 seeding points/ha |
| Afforestation fertilization | 6/1987 | 5/1988 | P 1.8 and K 3.4 g/seedling |
| 1st re-fertilization | No | 5/1993 | P 4.5 and K 8.0 g/seedling |
| Seedling stand clearing | 5/2003 | 10/1998 | naturally born birch removed |
| 2nd re-fertilization | No | 5/2002 | P 45 and K 80 kg ha–1 |
| Tending of seeded stands | No | 4/2003 | |
| Stand measurement | 11/2018 | 9/2018 | |
| No. of replications | 3 | 5–6 | n = 5 for seeding in Exp-S |
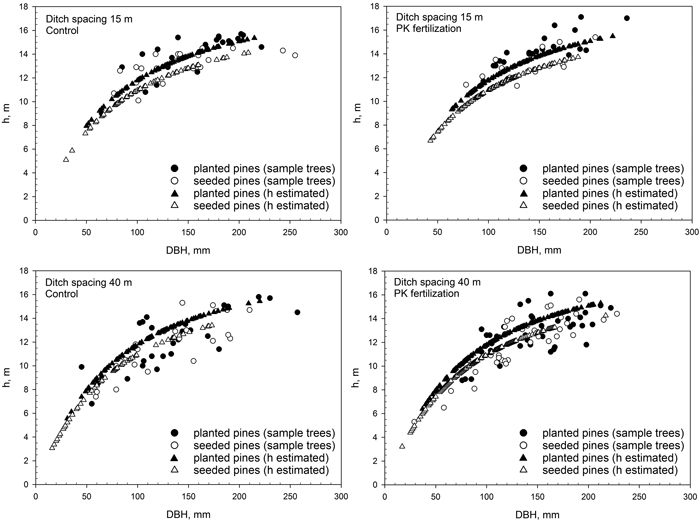
Fig. 1. The height and DBH distribution of Scots pine trees according to treatments in the afforestation experiment at the Exp-N site after 32 growing seasons since the stand establishment (naturally born trees included). Fertilization treatments: Control and PK fertilization with phosphorus and potassium during the afforestation stage. The ditch spacing is 15 or 40 m. The number of replications was three for all treatments. View larger in new window/tab.
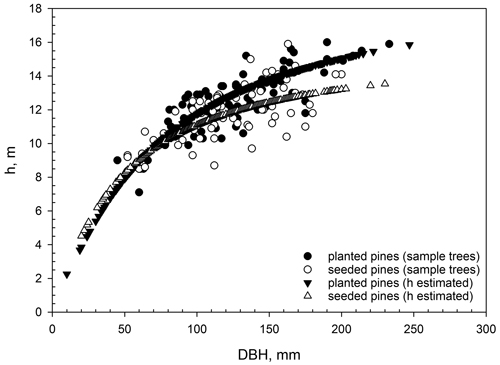
Fig. 2. The height and DBH distribution of Scots pine trees according to treatments in the afforestation experiment at the Exp-S site after 31 growing seasons since the stand establishment (naturally born trees included). The ditch spacing is 40 m.
| Table 2. Applied stumpage prices (€ m–3) and silvicultural costs (€ ha–1) in real terms. | ||
| Stumpage prices | ||
| Felling method | Saw logs ,€ m–3 | Pulpwood, € m–3 |
| First commercial thinning | 41.75 – 41.84 – 37.26 a) | 12.69 – 14.88 – 12.11 |
| Other thinnings | 50.08 – 49.73 – 41.40 | 15.62 – 19.32 – 14.80 |
| Final cut | 59.13 – 58.94 – 48.66 | 18.29 – 23.48 – 17.83 |
| Silvicultural costs, € ha–1 | ||
| Ditch network maintenance | 185.80 | |
| Manual planting | 697.60 | |
| Manual seeding | 217.60 | |
| Fertilization | 314.50 | |
| Early pre-commercial thinning | 356.50 | |
| a) In each line the first value (e.g., 41.75) applies for pine, the second (41.84) for spruce and the third (37.26) for other tree species, in most cases birches. | ||
| Table 3. The effect of the afforestation method on the rotation period, mean annual increment of stem wood (MAI) and saw logs (MAI_saw logs), and bare land value (BLV) with two rates of interest at the site in southern Finland (Exp-S; sd = standard deviation). In the financial analysis, 1rf includes one and 2rf two re-fertilizations before the first commercial thinning. | ||||
| Variable | Rate of interest (%) | Treatment (mean ± sd) | p-value | |
| Planted | Seeded | |||
| Rotation (a) | 3 | 71.0 ± 0.9 | 71.8 ± 1.3 | 0.259 |
| 5 | 70.3 ± 0.5 | 68.6 ± 3.2 | 0.220 | |
| MAI (m3 ha–1 a–1) | 3 | 9.5 ± 0.6 | 9.4 ± 0.6 | 0.756 |
| 5 | 9.3 ± 0.7 | 9.2 ± 0.8 | 0.812 | |
| MAI_saw logs (m3 ha–1 a–1) | 3 | 5.5 ± 0.2 | 5.3 ± 0.3 | 0.227 |
| 5 | 5.3 ± 0.2 | 4.9 ± 0.2 | 0.014 | |
| BLV_2rf (€ ha–1) | 3 | 2519.0 ± 405.5 | 2993.4 ± 389.0 | 0.081 |
| 5 | –380.5 ± 211.7 | 40.6 ± 157.0 | 0.005 | |
| BLV_1rf (€ ha–1) | 3 | 2742.5 ± 405.6 | 3216.0 ± 388.2 | 0.081 |
| 5 | –235.3 ± 207.0 | 190.0 ± 157.4 | 0.004 | |
| Table 4. The effect of the afforestation method, ditch spacing and fertilization on the rotation period (a), mean annual increment of stem wood (MAI, m3 ha–1 a–1) and saw logs (MAI_saw logs, m3 ha–1 a–1), and bare land value (BLV, € ha–1) with two rates of interest (%) for the Exp-N site (ANOVA p-values). | ||||||||
| Source/variable | Rotation | MAI | MAI_sawlogs | BLV | ||||
| Interest rate | 3 | 5 | 3 | 5 | 3 | 5 | 3 | 5 |
| Afforestation (A) | 0.247 | 0.180 | <0.001 | <0.001 | <0.001 | <0.001 | 0.003 | 0.327 |
| Ditch spacing (D) | 0.350 | 0.693 | 0.001 | <0.001 | 0.309 | 0.006 | 0.002 | <0.001 |
| Fertilization (F) | 0.504 | 0.278 | 0.001 | 0.009 | 0.176 | 0.058 | 0.050 | 0.009 |
| Block | 0.206 | 0.170 | 0.100 | 0.128 | 0.109 | 0.054 | 0.021 | 0.024 |
| A*D | 0.079 | 0.262 | 0.268 | 0.520 | 0.808 | 0.637 | 0.552 | 0.529 |
| A*F | 0.937 | 0.555 | 0.008 | 0.005 | 0.545 | 0.830 | 0.174 | 0.147 |
| D*F | 1.000 | 0.693 | 0.081 | 0.268 | 0.433 | 0.094 | 0.138 | 0.036 |
| A*D*F | 0.722 | 0.782 | 0.872 | 0.667 | 0.627 | 0.830 | 0.745 | 0.836 |
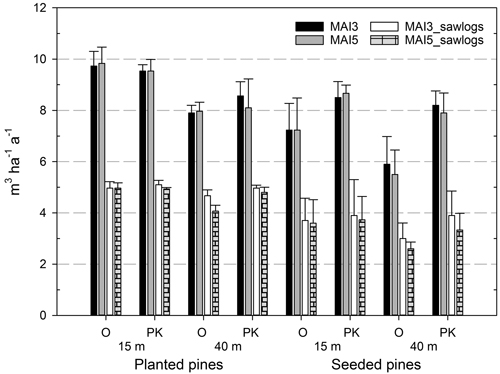
Fig. 3. Mean annual increment of stem wood (MAI) and saw logs (MAI_sawlogs) of Scots pine dominated stands at the northern Finland site (Exp-N) during a rotation period. The fertilization treatments consisted of a control (O) and fertilization with phosphorus and potassium during the afforestation stage (PK, see Table 1), and with ditch spacing of 15 and 40 m. The rates of interest are 3 and 5% (e.g., MAI3 and MAI5). The standard deviation is shown on top of the bars.
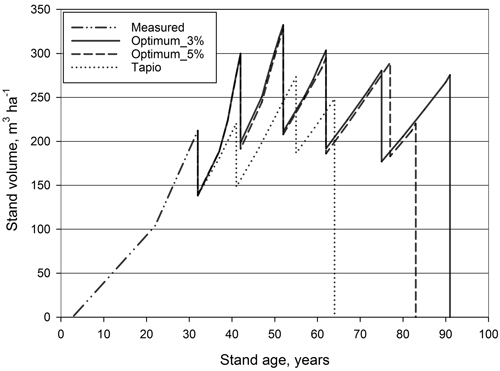
Fig. 4. Measured and predicted stand volume as a function of stand age, ongoing rotation (an example for a seeded pine stand, with ditch spacing of 15 m and no fertilization during the afforestation stage). Steeper curves are associated with the optimum (compared to Finnish recommendations, i.e. Tapio; Äijälä et al. 2014) and are due to repeated fertilizations.
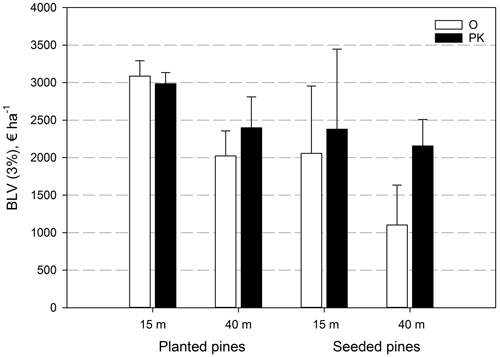
Fig. 5. The bare land value (BLV) of different growing alternatives of Scots pine dominated stands on the test sites in northern Finland (Exp-N) at a 3% rate of interest. The fertilization treatments consisted of a control (O) and fertilization with phosphorus and potassium during the afforestation stage (PK, see Table 1), and with ditch spacing of 15 and 40 m. The standard deviation is shown on top of the bars.