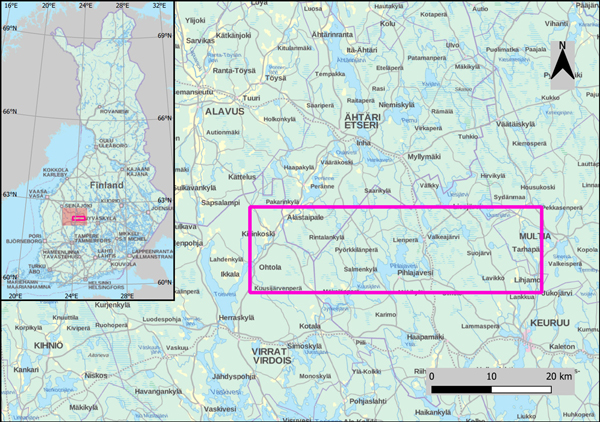
Fig. 1. Map of the study area.
| Table 1. The main statistics of the field data; mean, median, standard deviation (std) and maximum (max) of the 2013 and 2017 field data sets. | ||||||||
| 2013 | 2017 | |||||||
| Variable | mean | median | std | max | mean | median | std | max |
| Volume, m3 ha–1 | 126.3 | 121.4 | 81.5 | 380.8 | 126.1 | 113.9 | 88.6 | 475.5 |
| Pine volume, m3 ha–1 | 76.4 | 66.2 | 66.3 | 306.6 | 74.9 | 68.0 | 69.1 | 366.4 |
| Spruce volume, m3 ha–1 | 29.4 | 6.4 | 51.6 | 367.8 | 31.4 | 6.3 | 53.5 | 390.0 |
| Deciduous volume, m3 ha–1 | 20.5 | 7.5 | 32.3 | 215.6 | 19.8 | 4.4 | 33.8 | 218.1 |
| DBH, cm | 16.3 | 16.5 | 6.8 | 36.2 | 16.9 | 17.7 | 7.6 | 50.8 |
| Height, m | 13.4 | 14.1 | 5.1 | 27.2 | 13.7 | 14.9 | 5.6 | 25.9 |
| Basal area, m2 ha–1 | 17.3 | 17.4 | 8.7 | 45.0 | 16.4 | 16.3 | 9.3 | 50.6 |
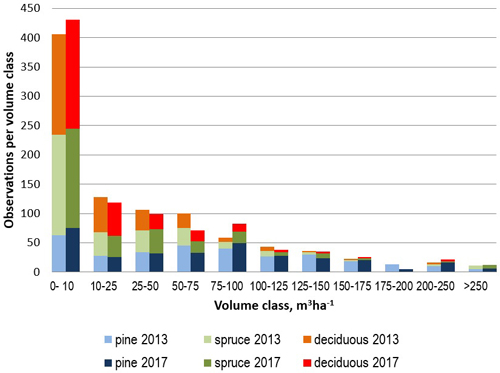
Fig. 2. Distribution of the species-specific growing stock volume classes in the 2013 and 2017 sample plot data sets.
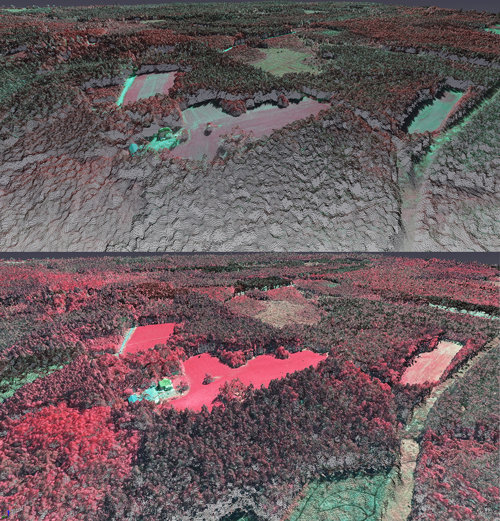
Fig. 3. Oblique view of the stereo-photogrammetric point clouds (points are colored with the spectral values of CIR image bands) based on the standard (top) and stereo-oriented (bottom) aerial data sets. Note the lower point density of the standard data visible in the foreground (there is a new clear-cut in the forefront of the point cloud derived from stereo-oriented image data).
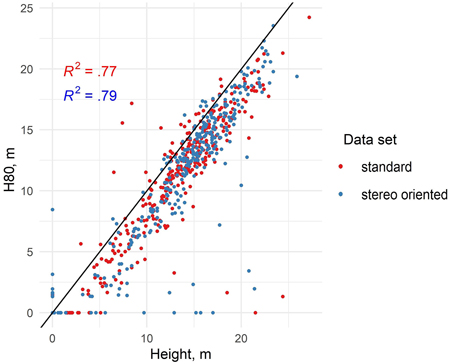
Fig. 4. Scatterplot showing the height at which 80% of canopy points are accumulated (H80) and stand mean height in standard and stereo-oriented data (linear trend line included).
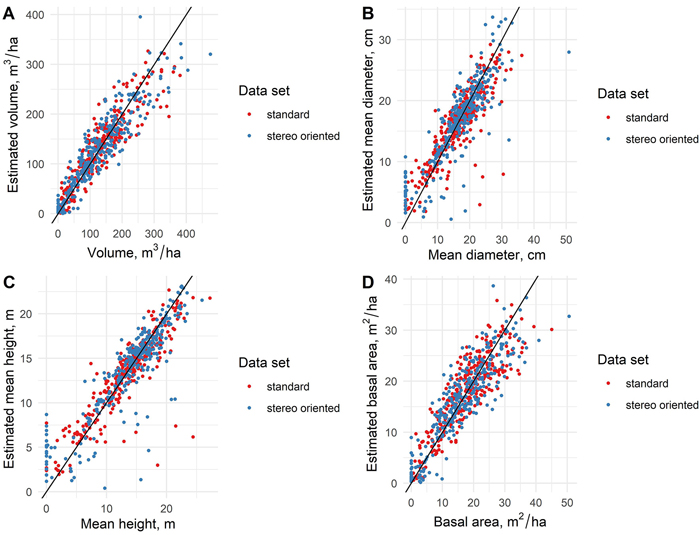
Fig. 5. The scatterplots presenting the measured values of forest variables as well as the values estimated with standard and stereo-oriented data sets.
| Table 2. The accuracy of forest variables (relative RMSE, R2 and relative bias) estimated with standard and stereo-oriented data sets (aerial data only) | ||||||
| RMSE% | R2 | Bias% | ||||
| Standard | Stereo-oriented | Standard | Stereo-oriented | Standard | Stereo-oriented | |
| Volume | 26.50 | 27.44 | 0.85 | 0.86 | 0.10 | –0.41 |
| Pine volume | 53.07 | 52.16 | 0.60 | 0.65 | 1.77 | 5.09 |
| Spruce volume | 136.03 | 112.78 | 0.39 | 0.50 | –0.17 | –10.87 |
| Deciduous volume | 104.94 | 107.75 | 0.39 | 0.43 | –5.74 | –4.62 |
| DBH | 21.93 | 23.16 | 0.71 | 0.75 | –1.16 | –0.08 |
| Height | 18.08 | 19.05 | 0.78 | 0.77 | –0.99 | –0.38 |
| Basal area | 23.98 | 25.46 | 0.76 | 0.79 | 0.56 | 0.08 |
| Table 3. The accuracy of forest variables (relative RMSE, R2 and relative bias) estimated with aerial data sets combined with contemporary (Landsat/Sentinel) satellite imagery. | ||||||
| RMSE% | R2 | Bias% | ||||
| Standard | Stereo-oriented | Standard | Stereo-oriented | Standard | Stereo-oriented | |
| Volume | 25.86 | 26.95 | 0.84 | 0.84 | 0.29 | –1.02 |
| Pine volume | 50.71 | 49.02 | 0.66 | 0.73 | 1.77 | 2.91 |
| Spruce volume | 124.96 | 98.81 | 0.50 | 0.66 | –0.59 | –6.27 |
| Deciduous volume | 101.56 | 102.74 | 0.59 | 0.65 | –3.98 | –7.59 |
| DBH | 22.27 | 22.18 | 0.59 | 0.72 | –0.61 | –0.05 |
| Height | 18.49 | 17.88 | 0.76 | 0.78 | –0.95 | –0.63 |
| Basal area | 23.65 | 25.64 | 0.78 | 0.79 | 1.39 | –0.01 |
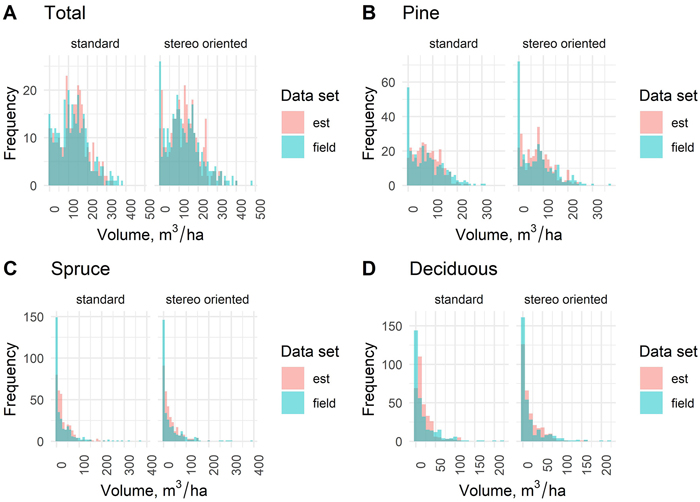
Fig. 6. Distribution of estimated (est) total and species-specific stand volumes based on standard and stereo-oriented data sets and the respective field measurements.
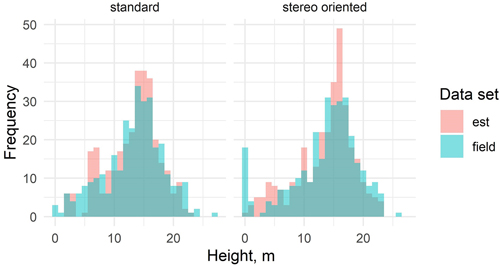
Fig. 7. Distribution of the stand mean height estimates based on standard and stereo-oriented data sets and the respective field measurements.