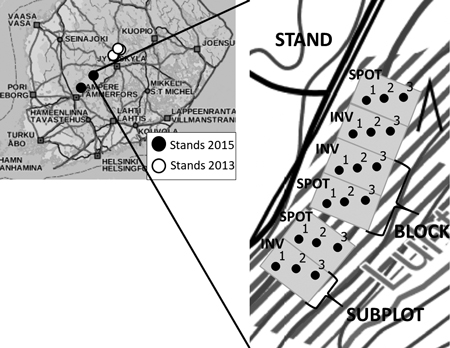
Fig. 1. Locations of six research stands in Finland and experimental design of the study within the stand. SPOT = spot mounding, INV = inverting.
| Table 1. Main characteristics of the six research stands to study the effects of spot mounding and inverting. | |||||||||
| Stand | Regen. year | Tree species | Number of blocks | Site typea | Stump harvesting | Soil texture | TWIb ± SD | Stoniness ± SD, cm | Particles <0.063 mm ± SD, % |
| 1 | 2013 | Spruce | 4 | MT | No | Medium-coarse | 7.4 ± 0.5 | 11.2 ± 4.8 | 34.4 ± 3.4 |
| 2 | 2013 | Spruce | 3 | MT | No | Medium-coarse | 6.8 ± 1.2 | 12.8 ± 4.9 | 45.0 ± 4.7 |
| 3 | 2013 | Spruce | 4 | OMT | Yes | Medium-coarse | 6.4 ± 0.6 | 14.1 ± 2.6 | 40.9 ± 10.6 |
| 4 | 2013 | Spruce | 4 | OMT | Yes | Medium-coarse | 7.5 ± 0.6 | 10.1 ± 4.3 | 30.2 ± 6.0 |
| 5 | 2015 | Pine | 4 | MT | No | Fine | 8.9 ± 2.1 | 25.5 ± 2.8 | 57.5 ± 14.0 |
| 6 | 2015 | Spruce | 4 | MT | No | Fine | 10.0 ± 1.6 | 24.8 ± 4.5 | 47.5 ± 19.0 |
| a Forest site type: MT = Myrtillus type forest, OMT = Oxalis-Myrtillus type forest. Soil fertility: MT < OMT (Cajander 1926). b TWI refers to the Topographic Wetness Index (Salmivaara et al. 2017). | |||||||||
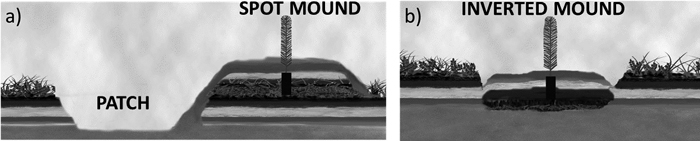
Fig. 2. Schematic illustration for the treatments of the study: a) spot mounding and b) inverting (Luoranen et al. 2007). In spot mounding, humus and mineral soil are inverted and placed beside the patch onto undisturbed soil whereas in inverting, inverted mound is returned to the patch it came from.
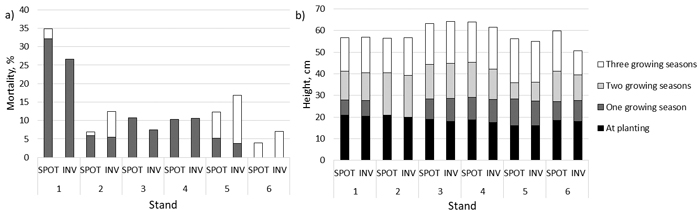
Fig. 3. Cumulative mortality (a) after first and third growing season and height (b) of seedlings at planting and after first, second, and third growing seasons in areas of spot mounding (SPOT) and inverting (INV). In stand two height was not measured one growing season after planting. View larger in new window/tab.
| Table 2. The effects of the site preparation method (spot mounding vs. inverting) on the number of birches regenerated (seedlings ha–1), the proportion of exposed mineral soil on site preparation (%),and the height of the planted seedlings (cm) three growing seasons after regeneration (linear mixed models). Parameter estimates, standard error (SE), and p-values are presented as well as standard deviation of random effects. Statistically significant p-values (p < 0.050) for the model coefficients are in bold. | ||||||
| Explanatory variables | Birch regeneration | Exposed mineral soil | The height of the seedling | |||
| Coeff. ± SE | p | Coeff. ± SE | p | Coeff. ± SE | p | |
| Intercept | 4.802 ± 0.288 | <0.001 | –1.040 ± 0.095 | <0.001 | 57.301 ± 1.967 | <0.001 |
| Site prep. [INVERTING] | –0.310 ± 0.094 | 0.004 | –0.161 ± 0.099 | 0.118 | 0.767 ± 1.698 | 0.656 |
| Standard deviation of random effects | ||||||
| Stand level | 0.674 | 0.152 | 3.755 | |||
| Block level | 0.236 | 0.000 | 0.000 | |||
| Residual | 0.307 | 0.326 | 5.597 | |||
| Table 3. Site preparation effects (spot mounding and inverting) on the occurrence of soil surface disturbance categories (mean ± standard deviation, %). | |||||||
| Site preparation | Mound | Patch | Otherwise disturbed | Undisturbed | Stone | Stump | |
| Whole data | Spot mounding | 17.6 ± 4.6 | 9.2 ± 5.0 | 20.9 ± 16.1 | 46.6 ± 15.5 | 4.9 ± 4.4 | 0.8 ± 0.6 |
| Inverting | 17.8 ± 4.1 | 5.8 ± 4.7 | 19.0 ± 19.1 | 53.0 ± 19.3 | 3.8 ± 4.3 | 0.7 ± 0.5 | |
| Stump harvesting excluded | Spot mounding | 17.6 ± 3.8 | 10.8 ± 4.4 | 11.8 ± 5.2 | 55.2 ± 11.9 | 3.5 ± 4.7 | 1.0 ± 0.6 |
| Inverting | 17.4 ± 2.8 | 4.8 ± 4.2 | 9.6 ± 5.5 | 64.5 ± 9.6 | 3.0 ± 4.5 | 0.7 ± 0.5 | |
| Table 4. Influence of fixed and random effects on the total variation of models of the number of birches regenerated (seedlings ha–1), the proportion of exposed mineral soil on site preparation (%), and the height of planted seedlings (cm). Full models refer to Table 2 and empty models to models estimated without fixed predictors. ICC refers to Intra Class Correlation. | |||||
| Response | Empty model | Full model | Influence of fixed effects, % | ||
| Variance estimate | ICC, % | Variance estimate | ICC, % | ||
| Stand level | |||||
| Birch regeneration | 0.438 | 71.5 | 0.454 | 75.2 | –1.8 |
| Exposed mineral soil | 0.022 | 16.7 | 0.023 | 17.9 | –2.0 |
| The height of the seedling | 13.920 | 31.2 | 14.100 | 31.0 | –0.64 |
| Block level | |||||
| Birch regeneration | 0.039 | 77.9 | 0.056 | 84.4 | –19.2 |
| Exposed mineral soil | 0.000 | 16.7 | 0.000 | 17.9 | –4.2 |
| The height of the seedling | 0.000 | 31.2 | 0.000 | - | 15.7 |
| All estimates of random effects converged in the calculations, but some were so small that they round to zero. | |||||
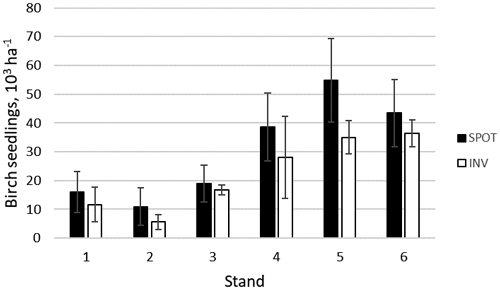
Fig. 4. Number and standard deviation of naturally regenerated birch seedlings (103 ha–1) in areas of spot mounding (SPOT) and inverting (INV).