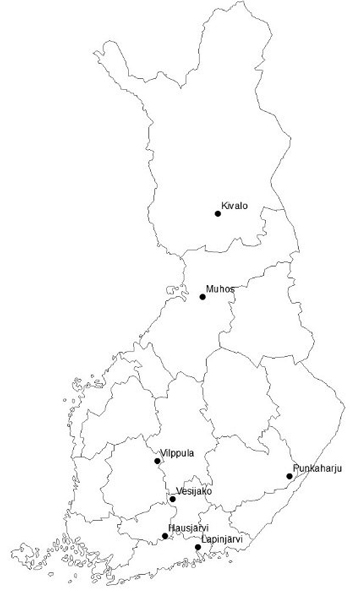
Fig. 1. Locations of the study stands in Finland.
| Table 1. Main characteristics of the study stands at the beginning of the experiment in 1980. | ||||||||
| Stand | Location | Coordinates (WGS84) | Effective temperature sum (DD) | Forest site type | Origin | Number of sample plots | Stand age, yr. | Dominant height, m |
| 1 | Lapinjärvi | 60°31´N, 26°03´E | 1386 | VT | Planted | 4 | 12 | 3.4 |
| 2 | Hausjärvi | 60°41´N, 24°53´E | 1309 | VT | Seeded | 2 | 12 | 3.3 |
| 3 | Vesijako | 61°20´N, 25°07´E | 1256 | VT | Naturally regenerated | 10 | 15 | 2.6 |
| 4 | Punkaharju | 61°45´N, 29°23´E | 1259 | MT | Naturally regenerated | 4 | 10 | 3.4 |
| 5 | Vilppula | 61°60´N, 24°30´E | 1195 | VT | Planted | 7 | 8 | 3.0 |
| 6 | Muhos | 64°53´N, 26°06´E | 1106 | VMT | Planted | 6 | 14 | 2.8 |
| 7 | Kivalo | 66°20´N, 26°43´E | 901 | HMT | Seeded | 6 | 15 | 2.7 |
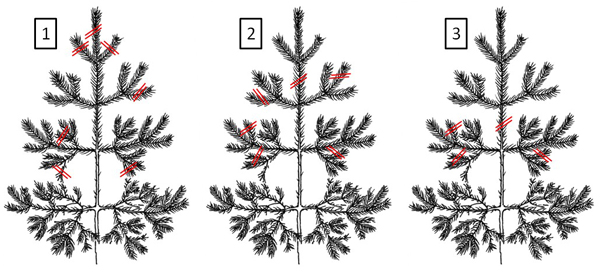
Fig. 2. Presentation of clipping treatments at the beginning of the experiments in 1980: 1) top shoot clipped along with all lateral twigs of the uppermost branch whorl, added with light clipping of branches; 2) main stem cut below the uppermost branch whorl, added with light clipping of branches; 3) main stem cut below the second branch whorl, added with light clipping of branches.
| Table 2. Numbers of the sample trees according to clipping treatments, mean values of diameter at breast height (DBH) and height (standard deviations in the parentheses), and minimum and maximum values in 1980 (beginning of the experiment) and 2014 (felling) in the study stands. | |||||||||
| First measurement in 1980 | Last measurement in 2014 | ||||||||
| Number of sample trees in different treatments | DBH, cm | Height, m | DBH, cm | Height, m | |||||
| Stand | Control | Clipping 1 | Clipping 2 | Clipping 3 | All trees | Mean (Std) Min–Max | Mean (Std) Min–Max | Mean (Std) Min–Max | Mean (Std) Min–Max |
| 1 | 15 | 15 | 9 | 7 | 46 | 2.4 (1.3) | 2.2 (0.6) | 14.0 (2.3) | 12.5 (1.3) |
| 0.0–4.9 | 1.1–3.3 | 9.0–18.8 | 9.9–15.6 | ||||||
| 2 | 6 | 4 | 4 | 2 | 16 | 2.5 (1.0) | 2.5 (0.5) | 14.4 (3.6) | 13.5 (2.0) |
| 0.7–4.7 | 1.5–3.5 | 5.9–22.3 | 7.8–15.8 | ||||||
| 3 | 18 | 13 | 12 | 7 | 50 | 1.3 (1.2) | 1.6 (0.5) | 16.8 (4.5) | 16.6 (2.1) |
| 0.0–4.8 | 0.8–3.2 | 8.1–28.0 | 11.5–20.2 | ||||||
| 4 | 12 | 8 | 8 | 5 | 33 | 3.2 (1.2) | 2.6 (0.7) | 18.7 (5.5) | 18.3 (1.9) |
| 1.4–5.4 | 0.3–4.0 | 9.1–28.9 | 13.6–21.5 | ||||||
| 5 | 18 | 16 | 15 | 12 | 61 | 2.7 (1.0) | 2.3 (0.4) | 15.8 (3.9) | 18.4 (2.0) |
| 1.1–5.3 | 1.6–3.5 | 7.6–23.2 | 12.7–22.2 | ||||||
| 6 | 17 | 12 | 8 | 6 | 43 | 2.1 (1.4) | 2.0 (0.6) | 16.3 (3.3) | 15.2 (1.6) |
| 0.0–5.7 | 0.9–3.7 | 8.2–24.3 | 11.1–19.1 | ||||||
| 7 | 18 | 8 | 6 | 6 | 38 | 1.5 (1.1) | 1.8 (0.5) | 17.4 (3.1) | 12.3 (1.4) |
| 0.0–3.6 | 0.9–2.8 | 10.0–23.1 | 8.7–14.5 | ||||||
| All | 104 | 76 | 62 | 45 | 287 | 2.2 (1.3) 0.0–5.7 | 2.1 (0.6) 0.3–4.0 | 16.2 (4.0) 5.9–28.9 | 15.6 (3.0) 7.8–22.2 |
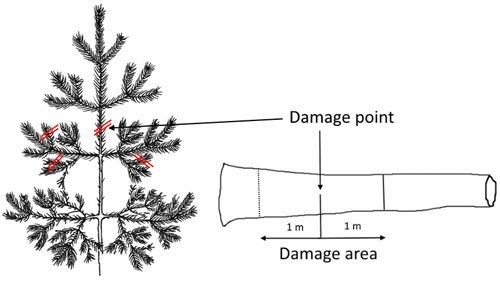
Fig. 3. Location of damage point in a sample tree at the beginning of the experiment, and in a butt log cut from the respective sample tree after 34 years. The damage area is defined one metre downwards and upwards from the damage point.
| Table 3. Quality requirements applied for butt logs of Scots pine in this study. These requirements were applied and generalized from bucking rules used by forest industries in Finland (Metsäkeskus 1999). | |||
| Characteristic | Quality requirements for sawlog grades 1–3 | ||
| Grade 1 | Grade 2 | Grade 3 | |
| Maximum branch diameter (mm) | |||
| - green branches | 15 | 30 | 60 |
| - dead branches | 10 | 25 | 40 |
| - vertical branches | 0 | 25 | 40 |
| Defects allowed | |||
| - only one vertical branch | no | yes | yes |
| - scars (length < 90 cm) *) | no | yes | yes |
| - sweep (over 1 cm m–1) | no | no | no |
| - single crook | no | no | no |
| - multiple crook, s-crook | no | no | no |
| - fork | no | no | no |
| - dead tree | no | no | no |
| *) outside of top cylinder. | |||
| Table 4. Number of butt logs in different log grades and top diameter classes (over bark) in this study. | |||
| Sawlog grade | Top diameter less than 15 cm | Top diameter 15 cm or more | All logs |
| Grade 1 | 1 | 0 | 1 |
| Grade 2 | 43 | 5 | 48 |
| Grade 3 | 10 | 26 | 36 |
| Pulpwood | 145 | 57 | 202 |
| Total | 199 | 88 | 287 |
| Table 5. Number and main characteristics of sample trees and their butt logs according to clipping treatment. Numbers of sample trees and butt logs as well as mean values, standard deviations (in parentheses), and ranges (between minimum and maximum values) of the variables are presented for the different treatments and all data. | ||||||
| Variable | Clipping treatment | All data | ||||
| No damage | Damage 1 | Damage 2 | Damage 3 | |||
| SAMPLE TREES | ||||||
| Number | N | 104 | 76 | 62 | 45 | 287 |
| Diameter at breast height, cm | Mean (Std) | 17.6 (4.0) | 15.8 (3.7) | 15.1 (3.7) | 15.3 (4.4) | 16.2 (4.0) |
| Min-Max | 9.9–28.9 | 8.4–28.0 | 5.9–24.3 | 7.6–23.6 | 5.9–28.9 | |
| Tree height, m | Mean (Std) | 15.9 (3.0) | 15.5 (2.9) | 15.5 (2.9) | 15.3 (3.2) | 15.6 (3.0) |
| Min-Max | 8.7–22.2 | 9.6–21.5 | 7.8–19.9 | 9.1–21.2 | 7.8–22.2 | |
| Height increment 1981–85, dm a–1 | Mean (Std) | 4.4 (1.3) | 4.4 (1.2) | 4.4 (1.3) | 4.2 (1.4) | 4.4 (1.3) |
| Min-Max | 1.1–6.9 | 0.8–7.8 | 1.3–6.2 | 1.6–6.5 | 0.8–7.8 | |
| Height increment 1981–90, dm a–1 | Mean (Std) | 4.5 (1.2) | 4.6 (1.2) | 4.6 (1.2) | 4.6 (1.3) | 4.6 (1.2) |
| Min-Max | 1.3–6.8 | 1.3–7.4 | 1.8–6.3 | 2.1–7.0 | 1.3–7.4 | |
| Height increment 2009–2013, dm a–1 | Mean (Std) | 3.8 (0.7) | 3.6 (0.9) | 3.5 (1.0) | 3.3 (1.4) | 3.6 (1.0) |
| Min-Max | 0.9–5.3 | 0.7–5.2 | 0.0–5.2 | 0.0–5.1 | 0.0–5.3 | |
| Height of the lowest dead branch, m | Mean (Std) | 1.7 (1.1) | 1.5 (1.1) | 1.2 (0.9) | 1.4 (1.1) | 1.5 (1.1) |
| Min-Max | 0.2–6.8 | 0.5–5.9 | 0.2–5.2 | 0.2–5.8 | 0.2–6.8 | |
| Height of the crown base, m | Mean (Std) | 8.8 (3.3) | 8.9 (3.3) | 9.3 (3.1) | 9.3 (3.3) | 9.0 (3.2) |
| Min-Max | 3.1–15.7 | 3.1–15.8 | 3.3–15.3 | 3.9–15.5 | 3.1–15.8 | |
| Tree volume, dm3 | Mean (Std) | 209 (119) | 165 (93) | 151 (83) | 156 (102) | 176 (105) |
| Min-Max | 36–638 | 35–566 | 13–417 | 31–389 | 13–638 | |
| BUTT LOGS | ||||||
| Number of all butt logs | N | 104 | 76 | 62 | 45 | 287 |
| Number of logs with top diameter over 15 cm | N | 45 | 20 | 12 | 11 | 88 |
| Number of logs with top diameter less than 15 cm | N | 59 | 56 | 50 | 34 | 199 |
| Top diameter of log, cm | Mean (Std) | 14.4 (3.6) | 12.8 (3.3) | 12.1 (3.3) | 12.1 (3.8) | 13.1 (3.6) |
| Min-Max | 6.9–25.2 | 6.5–23.8 | 3.0–18.9 | 5.4–19.6 | 3.0–25.2 | |
| Height of the biggest dead branch in a log, m | Mean (Std) | 3.2 (1.2) | 2.8 (1.3) | 2.7 (1.4) | 2.4 (1.5) | 2.8 (1.3) |
| Min-Max | 0.7–5.0 | 0.5–4.8 | 0.6–5.0 | 0.4–4.9 | 0.4–5.0 | |
| Diameter of the biggest dead branch, mm | Mean (Std) | 24.0 (6.9) | 22.1 (5.9) | 21.5 (4.7) | 22.7 (7.2) | 22.7 (6.3) |
| Min-Max | 11.0–46.0 | 9.0–35.0 | 14.0–34.0 | 11.0–49.0 | 9.0–49.0 | |
| Log volume, dm3 | Mean (Std) | 116 (54) | 94 (44) | 86 (41) | 89 (49) | 99 (50) |
| Min-Max | 31–308 | 25–279 | 11–212 | 21–196 | 11–308 | |
| Average sawlog volume, dm3 (based on quality of sawlog grade 3) | Mean (Std) | 45 (66) | 30 (51) | 24 (42) | 10 (32) | 31 (54) |
| Min-Max | 0–308 | 0–179 | 0–165 | 0–155 | 0–308 | |
| Table 6. Number of sample trees with different defects in butt logs, and proportions of butt logs with different defects according to clipping treatment and in all data. All defects were recorded within the damaged area of butt logs, but only the critical defects in terms of sawlog quality grading were taken into account. Respective proportions of defect-free butt logs are presented as well. | ||||||
| N | Proportion of butt logs (%) | |||||
| Control | Clipping 1 | Clipping 2 | Clipping 3 | All logs | ||
| Defects within damaged area in the butt log | ||||||
| thickest green branch | 11 | 2.9 | 2.6 | 4.8 | 6.7 | 3.8 |
| thickest dead branch | 124 | 40.4 | 47.4 | 41.9 | 44.4 | 43.2 |
| vertical branch | 80 | 8.7 | 25.0 | 48.4 | 48.9 | 27.9 |
| scar | 13 | 5.8 | 5.3 | 3.2 | 2.2 | 4.5 |
| fork | 5 | 1.0 | 0.0 | 1.6 | 6.7 | 1.7 |
| Defects in butt logs according to the bucking rules | ||||||
| green branch (>60 mm) | 1 | 0.0 | 0.0 | 0.0 | 2.2 | 0.3 |
| dead branch (>40 mm) | 2 | 1.0 | 0.0 | 0.0 | 2.2 | 0.7 |
| vertical branch (>40 mm) *) | 35 | 5.8 | 10.5 | 16.1 | 24.4 | 12.2 |
| scar | 23 | 7.7 | 7.9 | 6.5 | 11.1 | 8.0 |
| fork | 7 | 1.9 | 0.0 | 1.6 | 8.9 | 2.4 |
| form defect | 184 | 53.8 | 63.2 | 72.6 | 77.8 | 64.1 |
| dead tree | 3 | 0.0 | 0.0 | 1.6 | 4.4 | 1.0 |
| Defect-free logs according to the bucking rules **) | 85 | 39.4 | 28.9 | 27.4 | 11.1 | 29.6 |
| *) Only one vertical branch smaller than 40 mm in diameter allowed. **) Log diameter not taken into account in grading. | ||||||
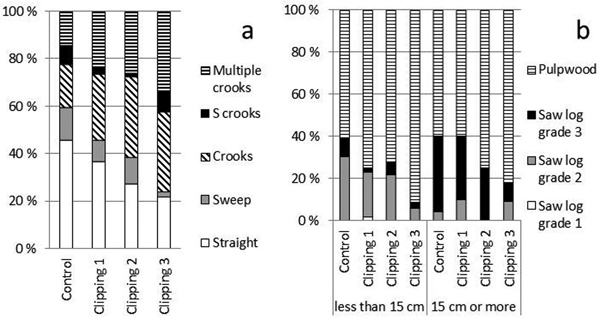
Fig. 4. a) Proportions of straight, sweeped, crooked, s-crooked, and multiple crooked butt logs among sample trees 34 years after artificial moose browsing damage. b) Proportions of different timber assortments (sawlog grades 1–3 and pulpwood) in the grading of butt logs grouped according to a top diameter of under 15 and over 15 cm in the undamaged control and clipping treatments. The log diameter was not accounted for in grading.
| Table 7. Parameter estimates, standard errors (SE) and p-values for ANCOVA models 1–3 (Eq. 1) predicting the diameter at breast height (DBH), height, and tree volume of trees 34 years after artificial moose browsing damage. | |||||||||
| Variable | Model 1: DBH, cm (r2 = 0.259) | Model 2: Height, m (r2 = 0.713) | Model 3: Volume, dm3 (r2 = 0.341) | ||||||
| Estimate | SE | p | Estimate | SE | p | Estimate | SE | p | |
| Intercept | 27.377 | 4.583 | <0.0001 | 54.695 | 2.109 | <0.0001 | 742.986 | 112.311 | <0.0001 |
| Tree height in 1980, cm | 0.023 | 0.004 | <0.0001 | 0.012 | 0.002 | <0.0001 | 0.603 | 0.087 | <0.0001 |
| Treatment (ref. no clipping) | |||||||||
| - Clipping 1 | –1.589 | 0.534 | 0.0032 | –0.498 | 0.246 | 0.0438 | –40.840 | 13.086 | 0.0020 |
| - Clipping 2 | –2.422 | 0.569 | <0.0001 | –0.867 | 0.262 | 0.0010 | –60.689 | 13.937 | <0.0001 |
| - Clipping 3 | –2.830 | 0.635 | <0.0001 | –1.202 | 0.292 | <0.0001 | –68.654 | 15.564 | <0.0001 |
| Site MT 1) | –12.081 | 5.238 | 0.0218 | –57.079 | 2.410 | <0.0001 | –861.684 | 128.375 | <0.0001 |
| Temperature sum in Site MT 2) | –0.001 | 0.002 | 0.5534 | 0.014 | 0.001 | <0.0001 | 0.199 | 0.060 | 0.0010 |
| Temperature sum in Site VT 3) | –0.012 | 0.004 | 0.0008 | –0.032 | 0.002 | <0.0001 | –0.524 | 0.087 | <0.0001 |
| 1) Values: 1 for a tree in Myrtillus site (or corresponding); otherwise 0. 2) Values: temperature sum (DD) for a tree in Myrtillus site (or corresponding); otherwise 0. 3) Values: temperature sum (DD) for a tree in Vaccinium site; otherwise 0. | |||||||||
| Table 8. Parameter estimates, standard errors (SE), and p-values for ANCOVA models 4–6 (Eq. 1) predicting the annual tree height increment of trees in years 1981–1985, 1981–1990, and 2009–2013. | |||||||||
| Variable | Model 4: Increment in 1981–1985, cm a–1 (r2 = 0.691) | Model 5: Increment in 1981–1990, cm a–1 (r2 = 0.771) | Model 6: Increment in 2009–2013, cm a–1 (r2 = 0.134) | ||||||
| Estimate | SE | p | Estimate | SE | p | Estimate | SE | p | |
| Intercept | 173.413 | 9.411 | <0.0001 | 193.340 | 7.704 | <0.0001 | 67.757 | 11.915 | <0.0001 |
| Tree height in 1980, cm | 0.027 | 0.007 | 0.0003 | 0.023 | 0.006 | 0.0001 | 0.021 | 0.009 | 0.0248 |
| Treatment (ref. no clipping) | |||||||||
| - Clipping 1 | –1.125 | 1.097 | 0.3059 | –0.354 | 0.898 | 0.6937 | –1.739 | 1.388 | 0.2115 |
| - Clipping 2 | –2.858 | 1.168 | 0.0150 | –1.388 | 0.956 | 0.1478 | –2.958 | 1.479 | 0.0464 |
| - Clipping 3 | –4.622 | 1.304 | 0.0005 | –1.748 | 1.068 | 0.1027 | –5.821 | 1.651 | 0.0005 |
| Site MT 1) | –226.552 | 10.757 | <0.0001 | –239.856 | 8.806 | <0.0001 | –53.590 | 13.619 | 0.0001 |
| Temperature sum in site MT 2) | 0.081 | 0.005 | <0.0001 | 0.077 | 0.004 | <0.0001 | 0.019 | 0.006 | 0.0032 |
| Temperature sum in site VT 3) | –0.103 | 0.007 | <0.0001 | –0.117 | 0.006 | <0.0001 | –0.028 | 0.009 | 0.0030 |
| 1) Values: 1 for a tree in Myrtillus site (or corresponding); otherwise 0. 2) Values: temperature sum (DD) for a tree in Myrtillus site (or corresponding); otherwise 0. 3) Values: temperature sum (DD) for a tree in Vaccinium site; otherwise 0. | |||||||||
| Table 9. Parameter estimates, standard errors (SE), and p-values for ANCOVA model 7 (Eq. 1) predicting the diameter of the thickest dead branch in a butt log 34 years after artificial moose browsing damage. | |||
| Variable | Model 7: Branch diameter, mm (r2 = 0.303) | ||
| Estimate | SE | p | |
| Intercept | 61.297 | 6.940 | <0.0001 |
| Tree height in 1980, cm | 0.025 | 0.006 | <0.0001 |
| Treatment (ref. no clipping) | |||
| - Clipping 1 | –1.842 | 0.812 | 0.0240 |
| - Clipping 2 | –2.816 | 0.861 | 0.0012 |
| - Clipping 3 | –2.102 | 0.972 | 0.0315 |
| Site MT 1) | –62.165 | 7.934 | <0.0001 |
| Temperature sum in site MT 2) | 0.019 | 0.004 | <0.0001 |
| Temperature sum in site VT 3) | –0.034 | 0.005 | <0.0001 |
| 1) Values: 1 for a tree in Myrtillus site (or corresponding); otherwise 0. 2) Values: temperature sum (DD) for a tree in Myrtillus site (or corresponding); otherwise 0. 3) Values: temperature sum (DD) for a tree in Vaccinium site; otherwise 0. | |||
| Table 10. Parameter estimates for the logistic regression models 8–10 (Eq. 2) predicting the probability of vertical branches and stem form defects in a butt log 34 years after artificial moose browsing damage. Model 8: all vertical branches within the damaged area in a butt log. Model 9: vertical branches with diameters of 40 mm or more in a whole butt log. Model 10: all stem form defects (which are not allowed in the sawlogs; see Table 3 for bucking rules) in the butt log. | ||||||
| Variable | Estimate | SE | Wald | df | p | Exp(B) |
| Model 8: | Vertical branches within damage area (all branches) (Nagelkerke R Square = 0.205) | |||||
| Intercept | –4.372 | 0.687 | 40.476 | 1 | <0.0001 | 0.013 |
| Tree height in 1980, cm | 0.009 | 0.002 | 13.179 | 1 | 0.0003 | 1.009 |
| Treatment (ref. no clipping) | 34.899 | 3 | <0.0001 | |||
| - Clipping 1 | 1.337 | 0.448 | 8.889 | 1 | 0.0029 | 3.808 |
| - Clipping 2 | 2.425 | 0.445 | 29.657 | 1 | <0.0001 | 11.306 |
| - Clipping 3 | 2.231 | 0.471 | 22.408 | 1 | <0.0001 | 9.312 |
| Model 9: | Vertical branches in whole butt log (branches of 40 mm or more) (Nagelkerke R Square = 0.109) | |||||
| Intercept | –4.390 | 0.829 | 28.064 | 1 | <0.0001 | 0.012 |
| Tree height in 1980, cm | 0.007 | 0.003 | 5.597 | 1 | 0.0180 | 1.007 |
| Treatment (ref. no clipping) | 8.676 | 3 | 0.0339 | |||
| - Clipping 1 | 0.682 | 0.568 | 1.442 | 1 | 0.2298 | 1.977 |
| - Clipping 2 | 1.189 | 0.550 | 4.676 | 1 | 0.0306 | 3.283 |
| - Clipping 3 | 1.532 | 0.553 | 7.662 | 1 | 0.0056 | 4.627 |
| Model 10: | Stem form defects in whole butt log (any crooks, sweep of 1 cm or more per one meter) (Nagelkerke R Square = 0.267) | |||||
| Intercept | –7.943 | 1.335 | 35.411 | 1 | <0.0001 | 0.000 |
| Temperature sum, DD | 0.005 | 0.001 | 26.029 | 1 | <0.0001 | 1.005 |
| Tree height in 1980, cm | 0.009 | 0.002 | 14.132 | 1 | 0.0002 | 1.009 |
| Treatment (ref. no clipping) | 8.305 | 3 | 0.0401 | |||
| - Clipping 1 | 0.323 | 0.341 | 0.897 | 1 | 0.3435 | 1.382 |
| - Clipping 2 | 0.820 | 0.378 | 4.700 | 1 | 0.0302 | 2.269 |
| - Clipping 3 | 1.100 | 0.458 | 5.777 | 1 | 0.0162 | 3.003 |
| Table 11. Parameter estimates for the logistic regression model 11 (Eq. 2) predicting the probability of achieving a sawlog quality butt log 34 years after artificial moose browsing damage. The butt log was graded as a sawlog only if the quality requirements for log grade 3 were met. Log diameter was not taken into account in grading. | ||||||
| Variable | Estimate | SE | Wald | df | p | Exp(B) |
| Model 11: | Probability of getting a sawlog according to the bucking rules (only quality notified) (Nagelkerke R Square = 0.283) | |||||
| Intercept | 4.249 | 1.7144 | 6.144 | 1 | 0.0132 | 70.064 |
| Temperature sum, DD | –0.003 | 0.0014 | 5.327 | 1 | 0.0210 | 0.997 |
| Tree height in 1980, cm | –0.007 | 0.0026 | 7.877 | 1 | 0.0050 | 0.993 |
| Site MT 1) | 0.842 | 0.3949 | 4.548 | 1 | 0.0330 | 2.321 |
| Treatment (ref. no clipping) | 8.397 | 3 | 0.0385 | |||
| - Clipping 1 | –0.301 | 0.3560 | 0.715 | 1 | 0.3978 | 0.740 |
| - Clipping 2 | –0.347 | 0.3795 | 0.834 | 1 | 0.3612 | 0.707 |
| - Clipping 3 | –1.611 | 0.5583 | 8.326 | 1 | 0.0039 | 0.200 |
| 1) Values: 1 for a tree in Myrtillus site (or corresponding); otherwise 0. | ||||||