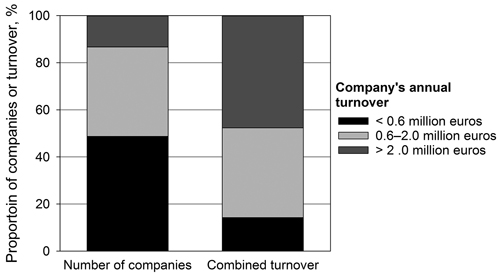
Fig. 1. Distribution of the numbers and combined turnover into turnover classes (less than 0.6 million euros, 0.6–2.0 million euros, more than 2.0 million euros) of the wood-harvesting members (limited companies) of the Association of Finnish Earth Moving and Wood Harvesting Contractors in 2017 (n = 353) (The Trade Association of Finnish Earth Moving and Wood Harvesting Contractors 2020).
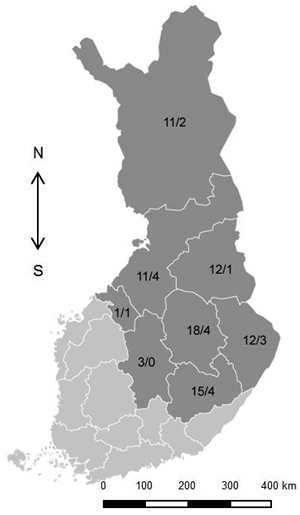
Fig. 2. Study area and the numbers of wood harvesting companies included in the financial analyses and interviews (economic analyses/interviews) by regions of Eastern and Northern Finland.
| Table 1. Categorisation of the wood harvesting companies (limited liability companies) included in the financial analyses and interviewed. | |||
| Turnover class | Annual turnover, million euros | Number of companies included in the financial analysis | Number of companies involved in the interviews |
| Small (S) | <0.6 | 31 | 8 |
| Medium (M) | 0.6–2.0 | 34 | 7 |
| Large (L) | >2 | 18 | 4 |
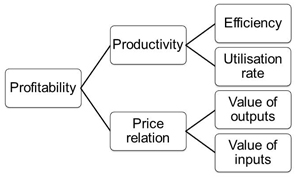
Fig. 3. The elements of profitability of a wood-harvesting enterprise – Hourunranta’s (2013) modification of the REALST model by van Loggerenberg and Cucchiaro (1981).
| Table 2. Key questions and examples of economic performance indicators in the business model analysis. | ||
| Business model component | Key questions | Examples of performance indicators |
| Customers and contracts | a) Who is the paying customer? | Types of customers (e.g. another wood harvesting enterprise, a forest industry company, and state forests) |
| b) How stable are the contracts? | The duration of the contract | |
| c) Who has the power in negotiations? | The role in the supply chain (subcontractor vs. prime contractor) The basis of the contract (bidding vs. negotiation) | |
| d) Does economic success depend on the services provided? | The services provided by the companies | |
| Human and material resources | e) What are the key competences of a successful company? | The managerial competence of the entrepreneur The educational background of the personnel |
| f) Are there differences in human capital? | The age of the company The allocation of responsibilities within the company | |
| g) Are resources used efficiently? | The degree of machinery utilisation The work-time allocation of the entrepreneur | |
| Organisation of activities | h) Is the entrepreneur’s work input clear in terms of profitability creation? | Annual working hours of the entrepreneurs |
| i) Are the operations organised cost-effectively? | The degree of machinery utilization The radius of the operation area The size of the site reserve The organisation of machine relocation and maintenance | |
| Business management | j) Is a systematic follow-up of the financial situation and operational efficiency seen in profitability? | The intensity of financial and operational monitoring |
| Business development | k) What are the factors affecting the future success of a wood-harvesting enterprise? | The respondents’ perception of strengths, weaknesses, opportunities, and threats of their businesses |
| l) Is there a need to develop the business model for the company’s survival? | The development plans identified by the respondents | |
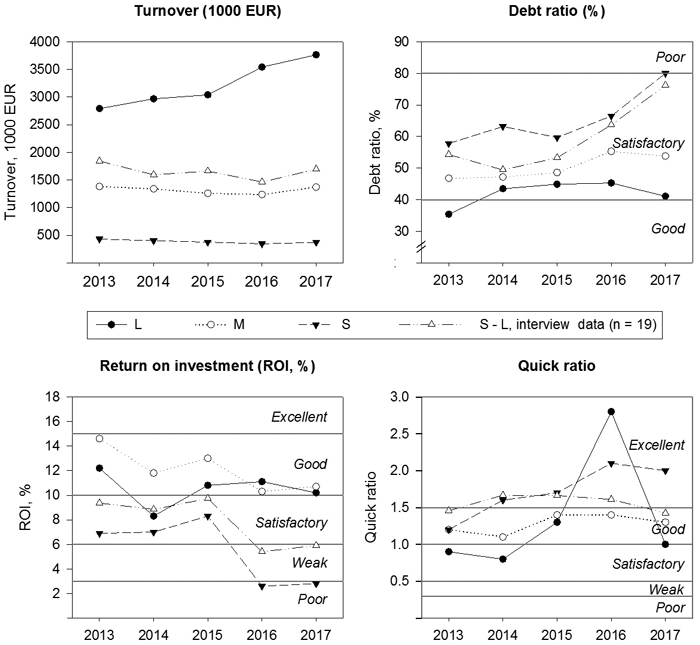
Fig. 4. Time series of the mean financial indicators for the 83 wood harvesting companies from Northern and Eastern Finland by turnover class (S = Small; M = Medium; L = Large), 2013–2017 (see Table 1). The figures for the 19 companies contributing to the interviews were combined. Reference values for debt ratio, ROI and quick ratio according to CCA (2013).
| Table 3. The financial indicators of the 19 wood harvesting companies included in the interview data from Eastern and Northern Finland, 2013–2017 (Sd = standard deviation). | ||||||
| Turnover class | ||||||
| Small (n = 8) | Medium (n = 7) | Large (n = 4) | ||||
| Mean | Sd 1) | Mean | Sd 1) | Mean | Sd 1) | |
| Turnover, 1000 euros | 480 | 156 | 1100 | 480 | 4100 | 236 |
| ROI | 3.1% | 10.4 pp | 7.9% | 6.3 pp | 7.4% | 3.9 pp |
| Debt ratio | 77% | 31 pp | 44% | 15 pp | 43% | 13 pp |
| Quick ratio | 1.81 | 0.59 | 1.59 | 0.52 | 0.97 | 0.42 |
| 1) Figures are based on five-year values (in all 95 observations). Standard deviations of percentage values are expressed in percentage points (pp). | ||||||
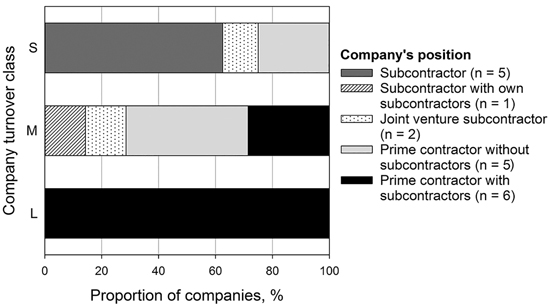
Fig. 5. The roles of the wood harvesting companies, based in Eastern and Northern Finland, in the wood supply chain.
| Table 4. Characteristics of customers and contracts of wood harvesting companies in Eastern and Northern Finland by turnover class based on entrepreneur interviews (n = 19). | |||
| Company turnover class | |||
| Small (n = 8) | Medium (n = 7) | Large (n = 4) | |
| Mean number of customers | 1.4 | 1.9 | 2.8 |
| Average total contracted volume, m3 a–1 | 48 400 | 139 300 | 461 000 |
| Average harvesting volume per customer, m3 | 38 800 | 88 600 | 184 400 |
| Duration of the customer relationship, years | 3 | 17 | 15 |
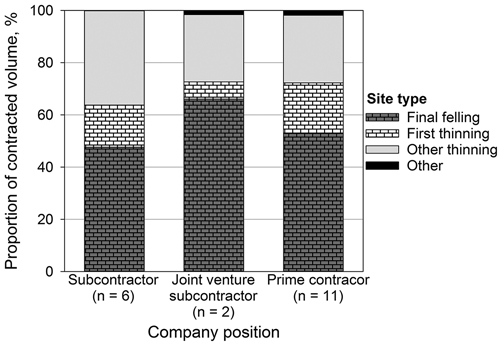
Fig. 6. The distribution of the contracted volume (m3) into site types by company role in the wood supply chain in Eastern and Northern Finland. The final allocation of contracted sites between the contractors and their subcontractors is unknown.
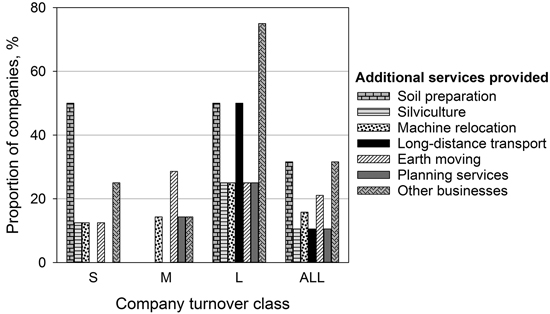
Fig. 7. Additional services provided by the wood harvesting companies (n = 19) in Eastern and Northern Finland by turnover class.
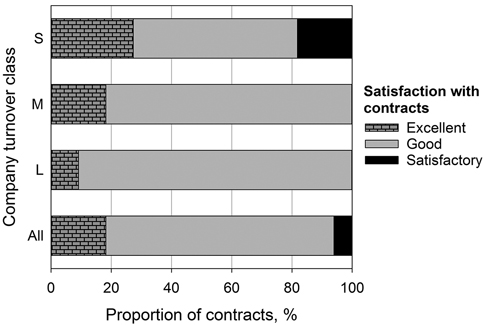
Fig. 8. The entrepreneurs’ evaluation of the quality of the business relationships with their clients by company turnover class. The assessment included 33 out of 35 business relationships of the 19 wood-harvesting companies based in Eastern and Northern Finland.
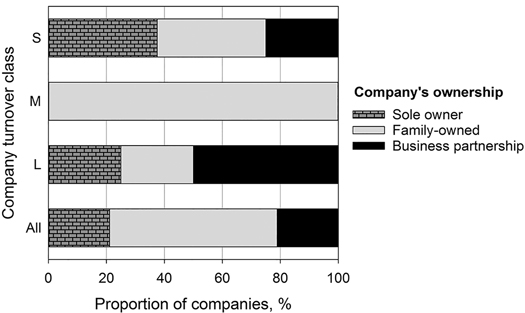
Fig. 9. Ownership of the wood harvesting companies in the interview data from Eastern and Northern Finland (n = 19).
| Table 5. Summary of the utilisation of human and corporeal resources by turnover class in the wood harvesting companies in Eastern and Finland. Only employees responsible for wood harvesting are included. The business mediator company was excluded when calculating the figures for machinery. | |||
| Turnover class | |||
| Small (n = 8) | Medium (n = 7) | Large (n = 4) | |
| Mean number of active owners | 1.2 | 1.6 | 1.8 |
| Mean number of employees | |||
| Operators | 2.5 | 10.4 | 14.0 |
| Supervisors etc. | - | - | 1.3 |
| Office staff and planners | - | - | 0.8 |
| Mean number of own harvesters | 1.4 | 3.4 | 6.7 |
| Mean number of own forwarders | 1.5 | 3.1 | 5.7 |
| Mean age of the machines, a | 6 | 3 | 4 |
| Number of harvester’s annual engine hours | 2600 | 2900 | 3100 |
| Number of forwarder’s annual engine hours | 2300 | 2300 | 2900 |
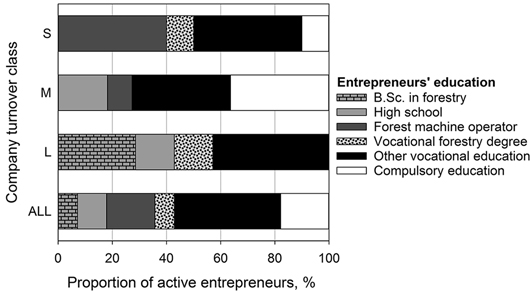
Fig. 10. Active entrepreneurs’ educational degrees by turnover class in the wood harvesting companies in Eastern and Northern Finland (n = 19).
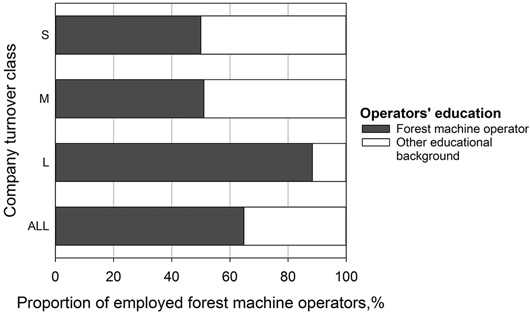
Fig. 11. Educational background of forest machine operators (employees) in the wood harvesting companies in Eastern and Northern Finland by turnover class (n = 19).
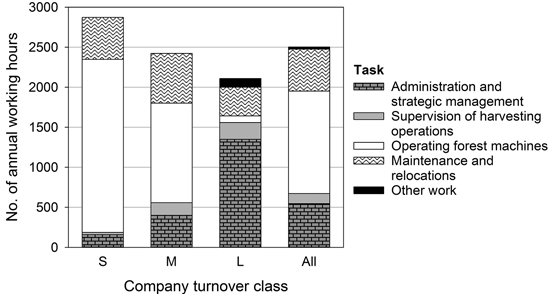
Fig. 12. Active shareholders’ annual working hours by work type and turnover class in wood harvesting companies in Eastern and Northern Finland (n = 19).
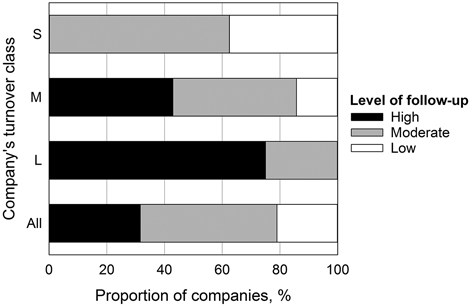
Fig. 13. The level of follow-up of profitability and operational parameters in the wood harvesting companies in Eastern and Northern Finland by turnover class (n = 19).
| Table 6. Internal and external factors affecting the success of the business, identified by the respondents representing various turnover classes (S–L) of wood harvesting companies (limited liability companies) in Eastern and Northern Finland (n = 19). The figures represent percentage of respondents in each turnover class. | ||||||||
| % of respondents 1) | % of respondents 1) | |||||||
| S | M | L | S | M | L | |||
| INTERNAL | Strengths | Weaknesses | ||||||
| Quality and reliability of services | 75 | 71 | 50 | Vulnerability due to scarce human resources | 25 | 43 | - | |
| Long experience and good reputation | 50 | 57 | 75 | Poor profitability of the business | 25 | - | 25 | |
| Competent personnel | 13 | 43 | 100 | Weak power in negotiations | 38 | - | - | |
| Good-quality and reasonable machinery | 37 | 71 | - | Lack of skilled operators | 25 | 14 | - | |
| Flexibility in meeting customers’ demands | 38 | 29 | 25 | Inefficiency of operations | - | 29 | - | |
| Size of the company | 13 | - | 50 | Dependence on a single business branch | - | 14 | 25 | |
| Inadequate leadership and management skills | 13 | - | 25 | |||||
| Old machinery | 25 | - | - | |||||
| Lack of successor for the business | 13 | 14 | 25 | |||||
| EXTERNAL | Opportunities | Threats | ||||||
| Expansion of the business | 38 | 29 | 75 | Fluctuation in the global economy | 63 | 14 | - | |
| New services beyond wood harvesting | 25 | 29 | 25 | Loss of employees | 38 | 29 | - | |
| New investments by the forest industry | 25 | 14 | - | Forest and climate policy | 13 | 14 | 50 | |
| Business exit | - | 14 | - | Harvesting prices too low (competition) | 25 | 14 | - | |
| Seasonal variation | 13 | 14 | - | |||||
| Risk of losing contracts | - | 29 | 25 | |||||
| 1) Proportion of respondents within each turnover class | ||||||||
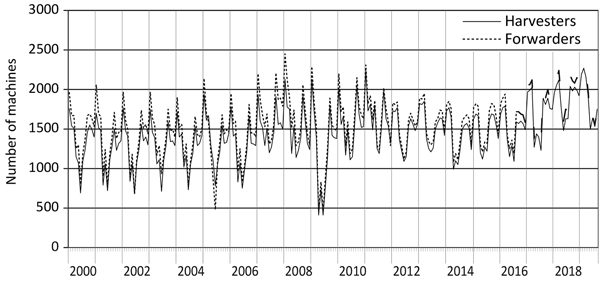
Fig. 14. Monthly numbers of harvesting machines used by month in Finland in the 2000s (Natural Resources Institute Finland 2020a).