| Table 1. Characteristics of the study sites: forest name, annual mean temperature (Tmean), annual precipitation, geographic location, site name, soil and humus type, dominant vegetation species, previous stand type and previous stand removal information. Climatic data are public data from Météo France. | |||||||||
| Forest | Tmean (°C) | Precipitation (mm) | Site | Location | Soil type | Humus type | Vegetation | Previous stand type | Stand removal type and date |
| Bord-Louviers | 11 | 730 | BL | 49°18´N, 01°09´E | Sandy-loamy | Dysmoder | Pteridium aquilinum | 120-year-old Scots pine | Windstorm 1999 |
| Haguenau | 10.4 | 758 | H1 | 48°50´N, 07°55´E | Sandy | Mor | Pteridium aquilinum | >100-year-old mixed Scots pine, beech and pedunculate oak | Windstorm 1999 |
| H2 | 48°49´N, 07°55´E | Sandy-loamy | Hydromor | Molinia caerulea | >50-year-old mixed Scots pine and oak | Windstorm 1999 | |||
| H3 | 48°49´N, 07°53´E | Sandy-loamy | Hydromor | Molinia caerulea | 25 to 30-year-old Scots pine | Windstorm 1999 | |||
| Villecartier | 11 | 850 | VI | 48°28´N, 01°33´W | Loamy | Mull | Pteridium aquilinum | >140-year-old beech | Progressive regeneration cut 2010 |
| Rennes | 12 | 860 | RE | 48°13´N, 01°32´W | Loamy | Hydromor | Molinia caerulea | 180-year-old oak | Progressive regeneration cut 2010 |
| Escource | 13.5 | 900 | ES | 44°12´N, 01°05´W | Sandy | Mor | Pteridium aquilinum | 50-year-old maritime pine | Clear cut 2008 |
| Solférino | 13.5 | 900 | SO | 44°08´N, 00°53´W | Sandy | Hydromor | Molinia caerulea | 50-year-old maritime pine | Clear cut 2008 |
| Table 2. Description of the experimental sites: planted tree species, planting date, mechanical site preparation (MSP) treatment date, experimental design and characteristics of HE and RR treatments. Treatment names: DS+MS, deep scarifier followed by multifunction subsoiler; HE, herbicide; RR, regional reference. View in new window/tab. |
| Table 3. Survival after one growing season of pine and oak seedling planted in eight experimental sites in Northern France, in different site preparation treatments (HE, herbicide; RR, regional reference; DS, deep scarifier; DS+MS, deep scarifier followed by multifunction subsoiler; C, untreated control). | ||||||||
| Site | Tree species | Vegetation | Plantation year | Survival rate (%) | ||||
| HE | RR | DS | DS+MS | C | ||||
| BL | Pinus nigra | Pteridium aquilinum | 2010 | 95 | 97 | 97 | 100 | 93 |
| H1 | Pinus sylvestris | Pteridium aquilinum | 2011 | 93 | 99 | 95 | 97 | 98 |
| VI | Pinus sylvestris | Pteridium aquilinum | 2011 | 93 | 87 | 98 | 94 | 64 |
| ES | Pinus pinaster | Pteridium aquilinum | 2011 | 50 | 61 | 62 | 62 | 44 |
| H2 | Pinus sylvestris | Molinia caerulea | 2011 | 99 | 99 | 100 | 100 | 95 |
| H3 | Pinus sylvestris | Molinia caerulea | 2011 | 99 | 97 | 100 | 100 | 79 |
| RE | Pinus sylvestris | Molinia caerulea | 2011 | 96 | 95 | 93 | 97 | 93 |
| SO | Pinus pinaster | Molinia caerulea | 2011 | 0 | 0 | 0 | 0 | 0 |
| BL | Quercus petraea | Pteridium aquilinum | 2010 | 97 | 98 | 94 | 96 | 93 |
| H1 | Quercus petraea | Pteridium aquilinum | 2011 | 69 | 68 | 24 | 2 | 43 |
| H1 | Quercus petraea | Pteridium aquilinum | 2012 | 89 | 86 | 89 | 85 | 77 |
| VI | Quercus petraea | Pteridium aquilinum | 2011 | 86 | 91 | 89 | 84 | 79 |
| ES | Quercus robur | Pteridium aquilinum | 2011 | 8 | 28 | 29 | 35 | 5 |
| H2 | Quercus petraea | Molinia caerulea | 2011 | 97 | 94 | 97 | 48 | 92 |
| H2 | Quercus petraea | Molinia caerulea | 2012 | 81 | - | - | 85 | - |
| H3 | Quercus petraea | Molinia caerulea | 2011 | 87 | 80 | 85 | 25 | 91 |
| H3 | Quercus petraea | Molinia caerulea | 2012 | 75 | - | - | 92 | - |
| RE | Quercus petraea | Molinia caerulea | 2011 | 98 | 97 | 96 | 98 | 98 |
| SO | Quercus robur | Molinia caerulea | 2011 | 58 | 70 | 88 | 82 | 67 |
| Table 4. Survival after four growing seasons of pine and oak seedling planted in eight experimental sites in Northern France, in different site preparation treatments (HE2, HE3 and HE4 herbicide applied during 2, 3 and 4 growing seasons, respectively; RR, regional reference; DS, deep scarifier; DS+MS, deep scarifier followed by multifunction subsoiler; HE, herbicide; C, untreated control). | ||||||||||
| Site | Tree species | Vegetation | Plantation year | Survival rate (%) | ||||||
| HE2 | HE3 | HE4 | RR | DS | DS+MS | C | ||||
| BL | Pinus nigra | Pteridium aquilinum | 2010 | - | 87 | - | 90 | 97 | 99 | 65 |
| H1 | Pinus sylvestris | Pteridium aquilinum | 2011 | - | - | 76 | 67 | 68 | 91 | 51 |
| VI | Pinus sylvestris | Pteridium aquilinum | 2011 | 63 | - | - | 73 | 91 | 90 | 40 |
| H2 | Pinus sylvestris | Molinia caerulea | 2011 | - | - | 90 | 97 | 97 | 97 | 84 |
| H3 | Pinus sylvestris | Molinia caerulea | 2011 | - | - | 93 | 89 | 91 | 97 | 56 |
| RE | Pinus sylvestris | Molinia caerulea | 2011 | 92 | - | - | 89 | 89 | 96 | 79 |
| BL | Quercus petraea | Pteridium aquilinum | 2010 | - | 90 | - | 97 | 90 | 90 | 82 |
| H1 | Quercus petraea | Pteridium aquilinum | 2012 | - | - | 84 | 57 | 79 | 78 | 47 |
| VI | Quercus petraea | Pteridium aquilinum | 2011 | 55 | - | - | 84 | 85 | 75 | 56 |
| H2 | Quercus petraea | Molinia caerulea | 2011 | - | - | 79 | 78 | 89 | - | 84 |
| H2 | Quercus petraea | Molinia caerulea | 2012 | - | - | 70 | - | - | 77 | - |
| H3 | Quercus petraea | Molinia caerulea | 2011 | - | - | 72 | 66 | 78 | - | 66 |
| H3 | Quercus petraea | Molinia caerulea | 2012 | - | - | 63 | - | - | 87 | - |
| RE | Quercus petraea | Molinia caerulea | 2011 | 54 | - | - | 50 | 46 | 89 | 57 |
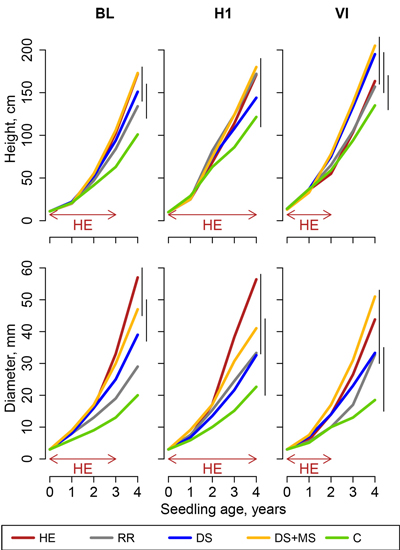
Fig. 1. Height and basal diameter of pine seedlings in Pteridium aquilinum sites (sites BL, H1 and VI, Northern France), following site preparation (HE: herbicide application; RR: regional reference; DS: deep scarifier; DS+MS: deep scarifier followed by multifunction subsoiler; C: untreated control). The horizontal arrow at the bottom of the graph indicates the length of time of herbicide application in treatment HE in each experimental site (from 2 to 4 years). The probability associated with the treatment effect is indicated in a linear model performed on height at the age of 4. Vertical segments on the right-hand side of the plot indicate the results of t-tests used for post-hoc mean comparisons (treatment means joined by a segment do not significantly differ).
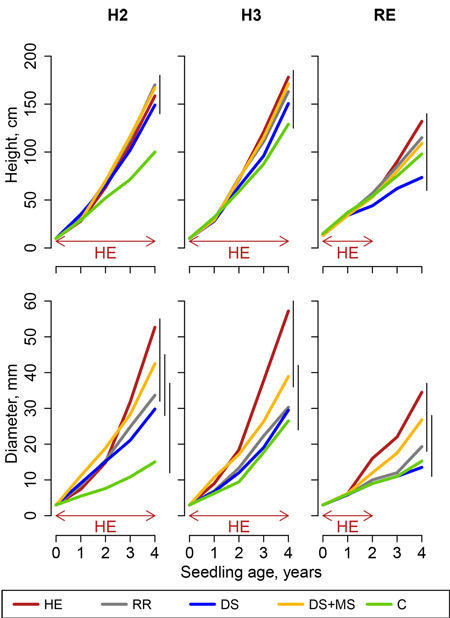
Fig. 2. Height and basal diameter of pine seedlings in Molinia caerulea sites (sites H2, H3 and RE, Northern France), following site preparation (HE: herbicide application; RR: regional reference; DS: deep scarifier; DS+MS: deep scarifier followed by multifunction subsoiler; C: untreated control). The horizontal arrow at the bottom of the graph indicates the length of time of herbicide application in treatment HE in each experimental site (from 2 to 4 years). The probability associated with the treatment effect is indicated in a linear model performed on height at the age of 4. Vertical segments on the right-hand side of the plot indicate the results of t-tests used for post-hoc mean comparisons (treatment means joined by a segment do not significantly differ).
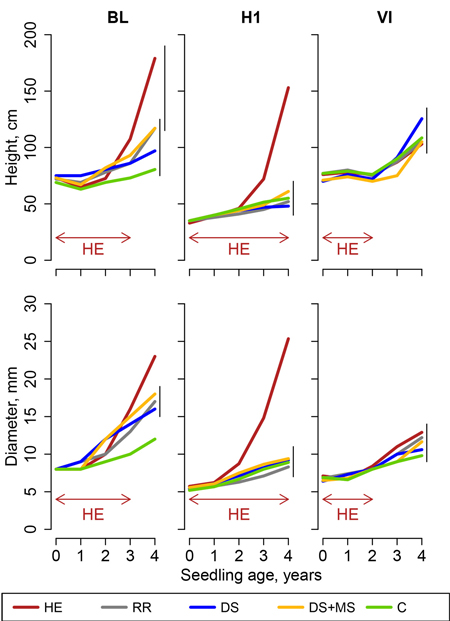
Fig. 3. Height and basal diameter of sessile oak seedlings in Pteridium aquilinum sites (sites BL, H1 and VI, Northern France), following site preparation (HE: herbicide application; RR: regional reference; DS: deep scarifier; DS+MS: deep scarifier followed by multifunction subsoiler; C: untreated control). The horizontal arrow at the bottom of the graph indicates the length of time of herbicide application in treatment HE in each experimental site (from 2 to 4 years). The probability associated with the treatment effect is indicated in a linear model performed on height at the age of 4. Vertical segments on the right-hand side of the plot indicate the results of t-tests used for post-hoc mean comparisons (treatment means joined by a segment do not significantly differ).
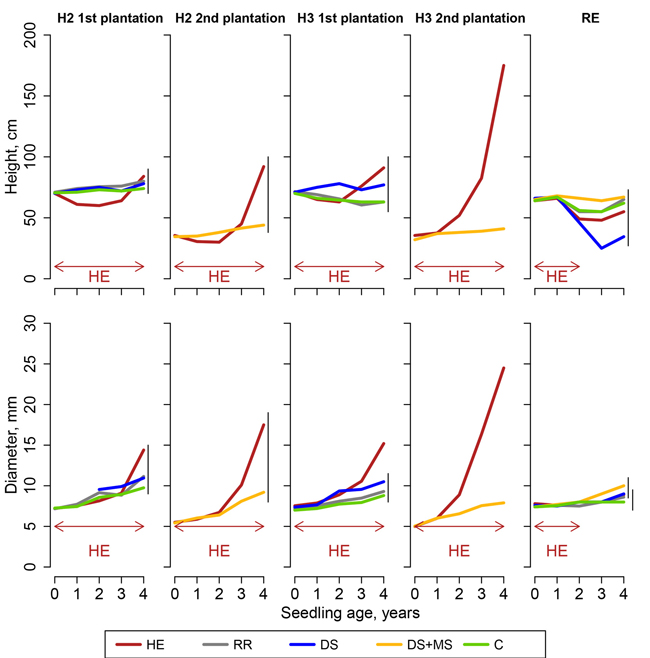
Fig. 4. Height and basal diameter of sessile oak seedlings in Molinia caerulea sites (sites H2, H3 and RE; H2 and H3 were planted twice, Northern France), following site preparation (HE: herbicide application; RR: regional reference; DS: deep scarifier; DS+MS: deep scarifier followed by multifunction subsoiler; C: untreated control). The horizontal arrow at the bottom of the graph indicates the length of time of herbicide application in treatment HE in each experimental site (from 2 to 4 years). The probability associated with the treatment effect is indicated in a linear model performed on height at the age of 4. Vertical segments on the right-hand side of the plot indicate the results of t-tests used for post-hoc mean comparisons (treatment means joined by a segment do not significantly differ).
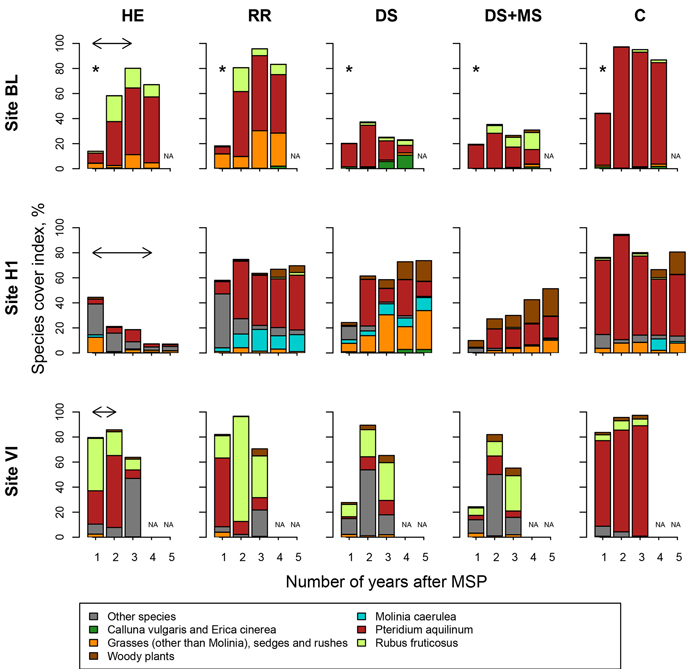
Fig. 5. Plant cover in Pteridium aquilinum sites (sites BL, H1 and VI, Northern France) following site preparation (HE: herbicide application; RR: regional reference site preparation method; DS: deep scarifier; DS+MS: deep scarifier followed by multifunction subsoiler; C: untreated control). For each species, plant cover was estimated using Eq. 2. In treatment HE, the horizontal arrow at the top of the graph indicates the length of time of herbicide application in each experimental site (from 2 to 4 years). Plant species were pooled into seven groups. The asterisks above the first year in site BL correspond to a floristic inventory carried out soon after late frosts in May that reduced P. aquilinum cover. NA indicates missing values for the corresponding year.
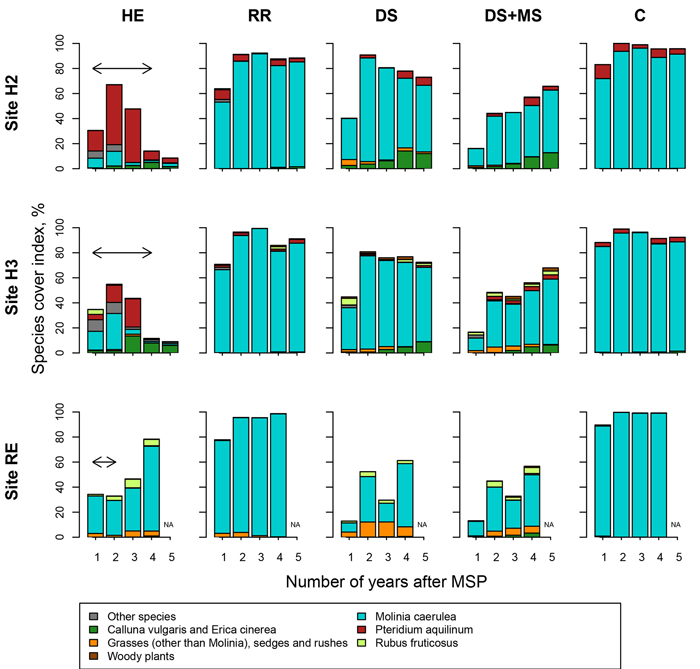
Fig. 6. Plant cover in Molinia caerulea sites (sites H2, H3, RE, Northern France) following site preparation (HE: herbicide application; RR: regional reference site preparation method; DS: deep scarifier, DS+MS: deep scarifier followed by multifunction subsoiler; C: untreated control). For each species, plant cover was estimated using Eq. 2. In treatment HE, the horizontal arrow at the top of the graph indicates the length of time of herbicide application in each experimental site (from 2 to 4 years). Plant species were pooled into seven groups. NA indicates missing values for the corresponding year.