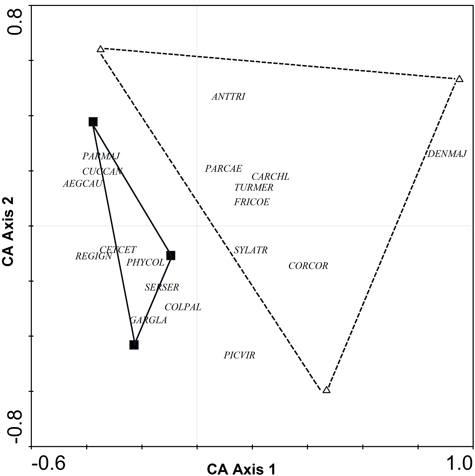
Fig. 1. CA ordination biplot for bird species and forest stands. Riparian forests are represented by black squares and poplar plantations (adult non-harrowed stands) by white triangles. Abbreviations of species names AEGCAU: Aegithalos caudatus; ANTTRI: Anthus trivialis; CARCHL: Carduelis chloris; CETCET: Cettia cetti; COLPAL: Columba palumbus; CORCOR: Corvus corone; CUCCAN: Cuculus canorus; DENMAJ: Dendrocopos major; FRICOE: Fringilla coelebs; GARGLA: Garrulus glandarius; PARCAE: Parus caeruleus; PARMAJ: Parus major; PHYCOL: Phylloscopus collybita; REGIGN: Regulus ignicapillus; SERSER: Serinus serinus; SYLATR: Sylvia atricapila; TURMER: Turdus merula.
| Table 1. List of bird species recorded in riparian forests and in the three non-harrowed poplar stands under study. Aerial, game and urban species were excluded. A six-letter abbreviation (first three letters of genus and species names) was used for species codes. | |||||
| Bird species | Species code | Riparian | Poplar | ||
| Number of stands | Abundance index | Number of stands | Abundance index | ||
| Fringilla coelebs | FRICOE | 3 | 17 | 3 | 17 |
| Phylloscopus collybita | PHYCOL | 3 | 11 | 2 | 3 |
| Cuculus canorus | CUCCAN | 3 | 8.5 | 1 | 2 |
| Columba palumbus | COLPAL | 3 | 8 | 1 | 2 |
| Aegithalos caudatus | AEGCAU | 2 | 7.5 | 0 | 0 |
| Serinus serinus | SERSER | 3 | 7 | 1 | 1 |
| Turdus merula | TURMER | 3 | 6 | 3 | 7 |
| Regulus ignicapillus | REGIGN | 2 | 5 | 0 | 0 |
| Cettia cetti | CETCET | 2 | 4 | 1 | 1 |
| Corvus corone | CORCOR | 2 | 4 | 2 | 5 |
| Parus caeruleus | PARCAE | 2 | 4 | 1 | 1 |
| Parus major | PARMAJ | 2 | 4 | 1 | 1 |
| Sylvia atricapilla | SYLATR | 3 | 4 | 2 | 2 |
| Carduelis chloris | CARCHL | 3 | 3 | 3 | 4 |
| Garrulus glandarius | GARGLA | 2 | 3 | 0 | 0 |
| Picus viridis | PICVIR | 2 | 2 | 1 | 3 |
| Troglodytes troglodytes | TROTRO | 1 | 2 | 0 | 0 |
| Anthus trivialis | ANTTRI | 1 | 1 | 1 | 0.5 |
| Carduelis carduelis | CARCAR | 1 | 1 | 1 | 1 |
| Certhia brachydactyla | CERBRA | 1 | 1 | 0 | 0 |
| Coccothraustes coccothraustes | COCCOC | 1 | 1 | 1 | 1 |
| Emberiza cirlus | EMBCIR | 1 | 1 | 1 | 1 |
| Emberiza citrinella | EMBCIT | 1 | 1 | 0 | 0 |
| Erithacus rubecula | ERIRUB | 1 | 1 | 1 | 1 |
| Hippolais polyglotta | HIPPOL | 1 | 1 | 0 | 0 |
| Jynx torquilla | JYNTOR | 1 | 1 | 1 | 1 |
| Luscinia megarhynchos | LUSMEG | 1 | 1 | 0 | 0 |
| Sylvia borin | SYLBOR | 1 | 1 | 0 | 0 |
| Sylvia melanocephala | SYLMEL | 1 | 1 | 0 | 0 |
| Turdus viscivorus | TURVIS | 1 | 1 | 0 | 0 |
| Carduelis cannabina | CARCAN | 0 | 0 | 1 | 1 |
| Dendrocopus major | DENMAJ | 0 | 0 | 2 | 2.5 |
| Parus ater | PARATE | 0 | 0 | 1 | 2 |
| Phylloscopus trochilus | PHYTRO | 0 | 0 | 1 | 1 |
| Sylvia communis | SYLCOM | 0 | 0 | 1 | 1 |
| Abundance index: sum of the heard and seen birds, using a semi-quantitative abundance index where a territorial male or pair was noted as 1 and a non-singing bird was noted as 0.5. | |||||
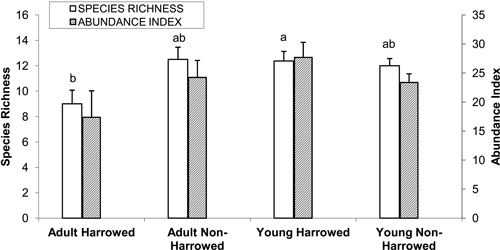
Fig. 2. Mean (± S.E.) bird species richness and abundance index. Bars with different letters indicate significantly different means (Tukey’s post hoc test, α = 0.05). Species richness: number of different species represented in each stand. Abundance index: sum of the heard and seen birds, using a semi-quantitative abundance index where a territorial male or pair was noted as 1 and a non-singing bird was noted as 0.5.
| Table 2. Coefficients of correlation between dendrometric, understory and landscape variables and the significant axes (D) of each principal component analysis (PCA) carried out for six different buffer radii. The highest correlations are shown in bold type. View in new window/tab. |
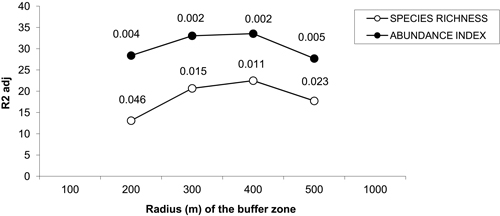
Fig. 3. Percentage of variance of bird species richness and abundance index explained by the multiple linear model in which the coordinates of sampled poplar stands along the significance axes from PCAs are included as explanatory variables. The p-values for each radius buffer are shown above each line for each buffer size. No values were represented for buffers of radius 100 and 1000 m because the respective models were not significant. Species richness: number of different species represented in each stand. Abundance index: sum of the heard and seen birds, using a semi-quantitative abundance index where a territorial male or pair was noted as 1 and a non-singing bird was noted as 0.5.
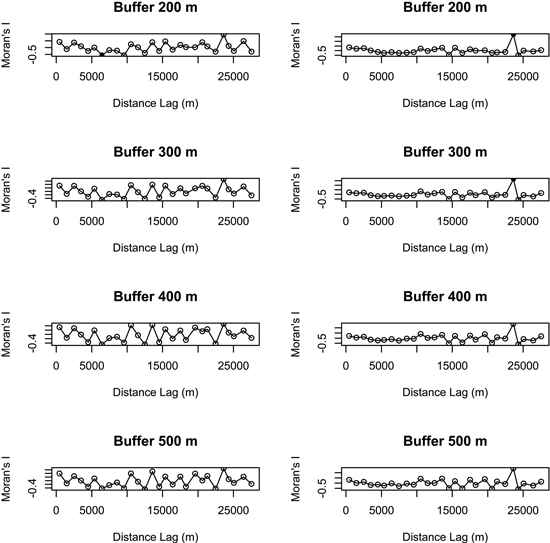
Fig. 4. Spatial correlograms (Moran’s I values) of model residuals against distance classes for bird species richness (on the left) and abundance index (on the right) in different buffers (no values were represented for buffers of 100 m and 1000 m radius because the respective models were not significant). Values significant at a nominal (two-sided) 5 % level are represented by black dots and non-significant values by open circles. Species richness: number of different species represented in each stand. Abundance index: sum of the heard and seen birds, using a semi-quantitative abundance index where a territorial male or pair was noted as 1 and a non-singing bird was noted as 0.5.
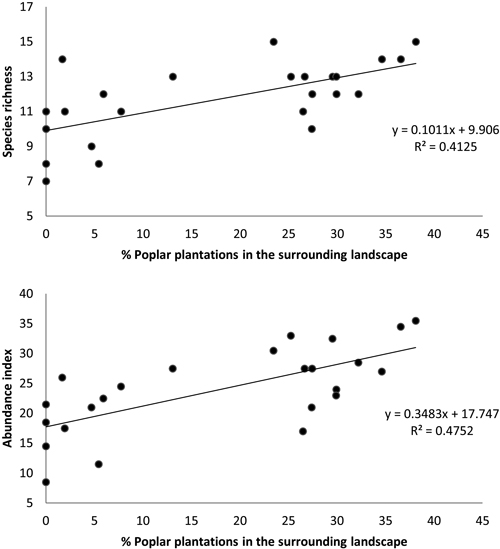
Fig. 5. Relationship between (a) bird species richness and (b) bird abundance index and the percent cover of poplar plantations (excluding area of sampled stand) within a circular buffer of 400 m radius. Species richness: number of different species represented in each stand. Abundance index: sum of the heard and seen birds, using a semi-quantitative abundance index where a territorial male or pair was noted as 1 and a non-singing bird was noted as 0.5.
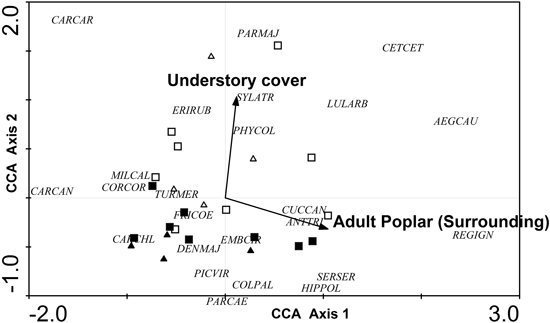
Fig. 6. CCA ordination biplot for bird species, forest stands and the significant environmental variables (dendrometric, understory and landscape variables with a 400 m radius buffer). Type of forest: adult harrowed stands are represented by black triangles, young harrowed stands by black squares, adult non-harrowed stands by white triangles and young non- harrowed stands by white squares. Abbreviations of species names AEGCAU: Aegithalos caudatus; ANTTRI: Anthus trivialis; CARCAN: Carduelis cannabina; CARCAR: Carduelis carduelis; CARCHL: Carduelis chloris; CETCET: Cettia cetti; COLPAL: Columba palumbus; CORCOR: Corvus corone; CUCCAN: Cuculus canorus; DENMAJ: Dendrocopos major; EMBCIR: Emberiza cirlus; ERIRUB: Erithacus rubecula; FRICOE: Fringilla coelebs; GARGLA: Garrulus glandarius; HIPPOL: Hippolais polyglotta; LULARB: Lullula arborea; MILCAL: Miliaria calandra; PARCAE: Parus caeruleus; PARMAJ: Parus major; PHYCOL: Phylloscopus collybita; PICVIR: Picus viridis; REGIGN: Regulus ignicapillus; SERSER: Serinus serinus; SYLATR: Sylvia atricapila; TURMER: Turdus merula.