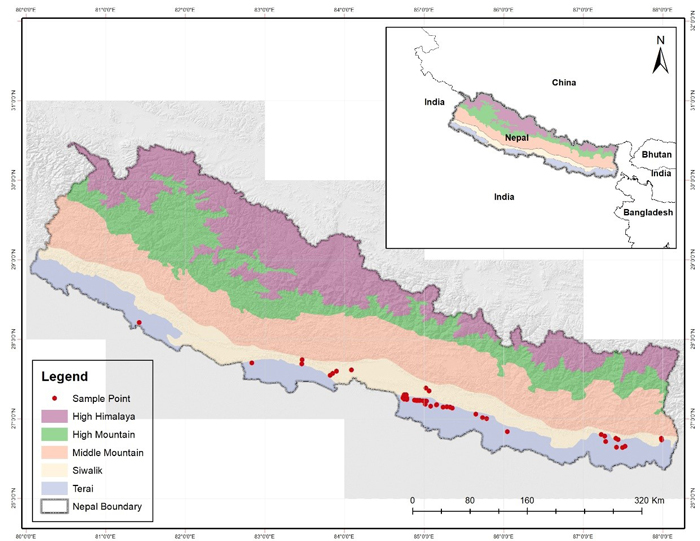
Fig. 1. Map of study area with the five distinct physiographic regions and presence locations of Dalbergia latifolia in Nepal. View larger in new window/tab.
| Table 1. List of 19 bioclimatic variables used for habitat suitability model development for Dalbergia latifolia. All of the descriptions and values are based on WorldClim data (Hijmans et al. 2005; O’Donnell et al. 2012). | |||||
| Code | Bioclimatic Variable | Unit | Minimum | Maximum | Scaling Factor |
| Bio1 | The annual mean temperature | Degrees Celsius | –290 | 320 | 10 |
| Bio2 | Mean diurnal range: (Mean of monthly (max temp – min temp)) | Degrees Celsius | 9 | 214 | 10 |
| Bio3 | Isothermality: (Mean diurnal range/annual temperature range) × 100 or (BIO2/BIO7) × 100 | Percentage | 7 | 96 | 100 |
| Bio4 | Temperature Seasonality: (Standard deviation ×100) | Degrees Celsius | 62 | 22 721 | 100 |
| Bio5 | Maximum Temperature of Warmest Month: maximum temperature value across all months within a given year | Degrees Celsius | –96 | 490 | 10 |
| Bio6 | Minimum Temperature of Coldest Month: minimum temperature value across all months within a given year | Degrees Celsius | –573 | 258 | 10 |
| Bio7 | Temperature Annual Range: (Bio5 – Bio6) | Degrees Celsius | 53 | 725 | 10 |
| Bio8 | Mean Temperature of Wettest Quarter | Degrees Celsius | –285 | 378 | 10 |
| Bio9 | Mean Temperature of Driest Quarter | Degrees Celsius | –521 | 366 | 10 |
| Bio10 | Mean Temperature of Coldest Quarter | Degrees Celsius | –143 | 383 | 10 |
| Bio11 | Mean Temperature of Coldest Quarter | Degrees Celsius | –521 | 289 | 10 |
| Bio12 | Annual Precipitation: This is the sum of all total monthly precipitation values | Millimeters | 0 | 11 401 | 1 |
| Bio13 | Precipitation of Wettest Month | Millimeters | 0 | 2949 | 1 |
| Bio14 | Precipitation of Driest Month | Millimeters | 0 | 752 | 1 |
| Bio15 | Precipitation Seasonality: (Coefficient of Variation) | Fraction | 0 | 265 | 100 |
| Bio16 | Precipitation of Wettest Quarter | Millimeters | 0 | 8019 | 1 |
| Bio17 | Precipitation of Driest Quarter | Millimeters | 0 | 2495 | 1 |
| Bio18 | Precipitation of Warmest Quarter | Millimeters | 0 | 6090 | 1 |
| Bio19 | Precipitation of Coldest Quarter | Millimeters | 0 | 5162 | 1 |
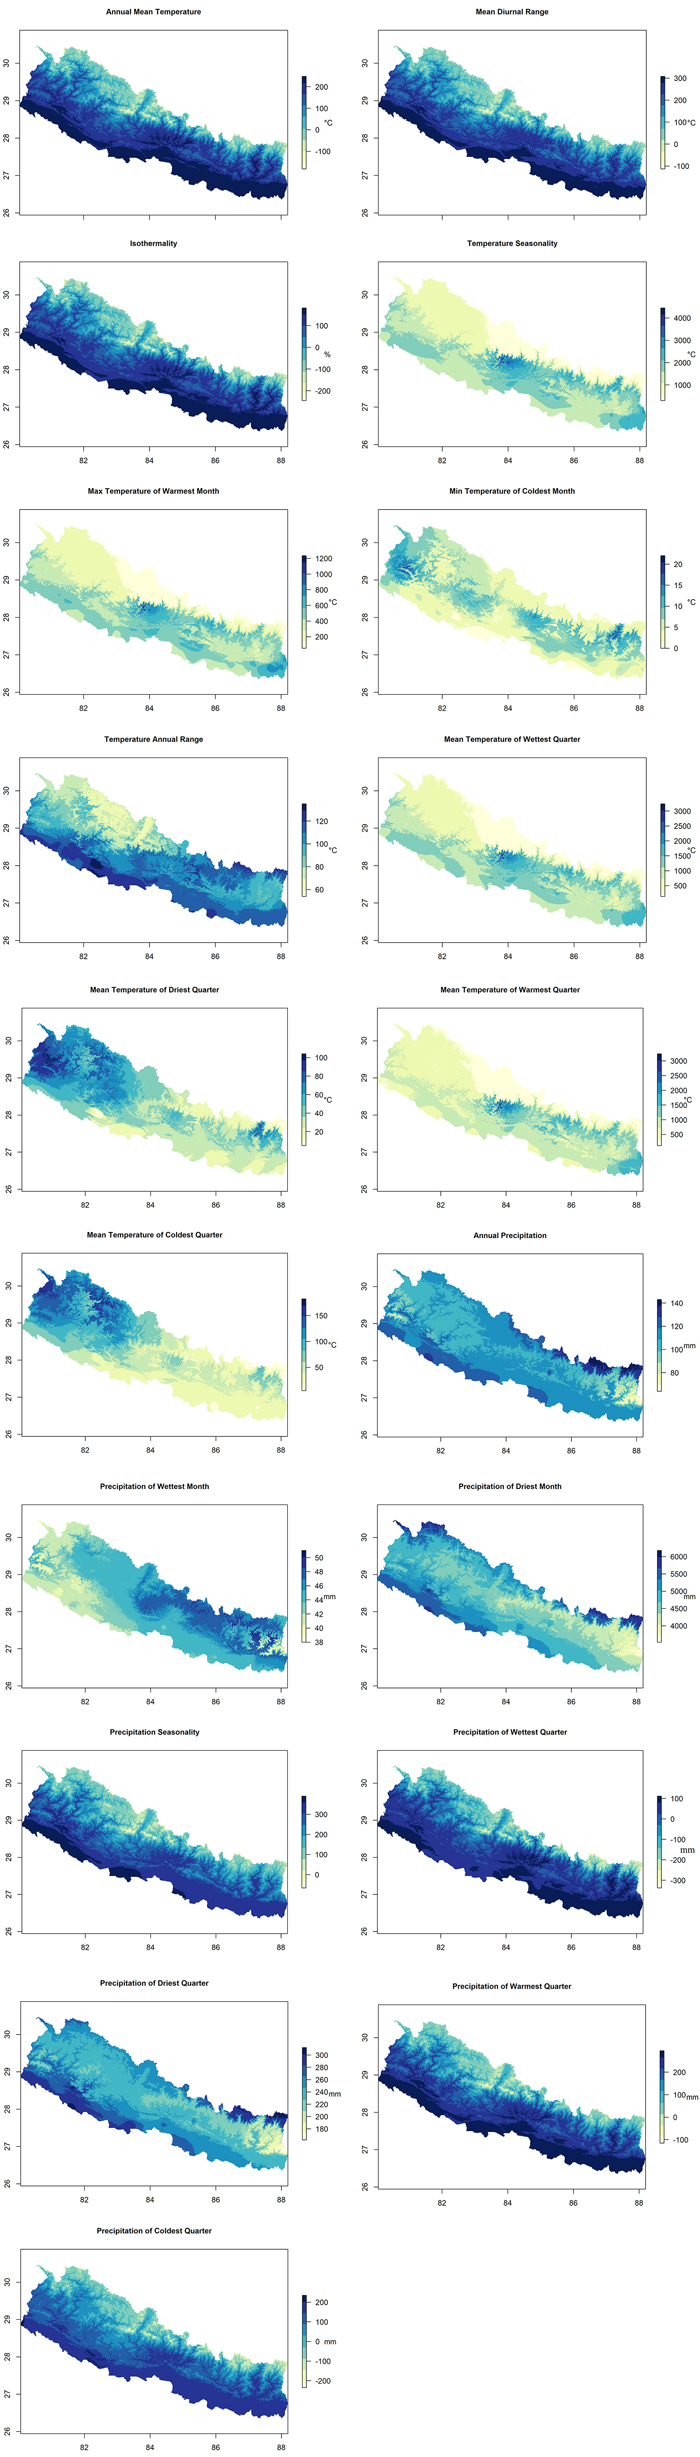
Fig. 2. Spatial distribution of selected Bioclimatic variables used for mapping and habitat suitability modelling of Dalbergia latifolia in Nepal (Table 1). These spatial products were derived from 19 original (modification was not made) bioclimatic variables developed by Hijmans et al. (2005) (posted on the Bioclim website; https://www.worldclim.org/). Scaling factor (see Table 1) is used in the units of the studied variables. (Note: “°C” is degree centigrade, “mm” is millimeter and “%” is percentage). View larger in new window/tab.
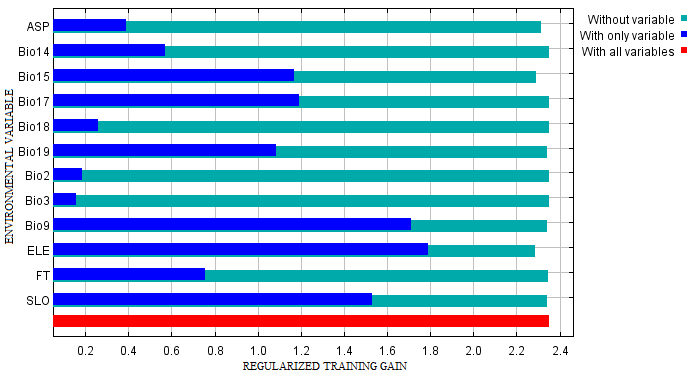
Fig. 3. The Jackknife test for evaluating the relative importance of environmental variables for Dalbergia latifolia Maxent model on habitat suitability. (Note: “ASP” is aspect; “Bio14 is Precipitation of driest period; “Bio15” is Precipitation seasonality; “Bio17” is Precipitation of driest quarter; “Bio18” is Precipitation of warmest quarter; “Bio19” is Precipitation of coldest quarter; “Bio2” is Mean diurnal range; “Bio3” is isothermality; “Bio9” is Mean temperature of driest quarter; “ELE” is elevation; “FT” is forest types and “SLO” is slope).
| Table 2. Selected environmental variables and their percent contribution in the Maxent model on habitat suitability for Dalbergia latifolia in Nepal. | |||
| Code | Environmental Variables | Percent Contribution | Cumulative Percent Contribution |
| ELE | Elevation (m) | 71.3 | 71.3 |
| Bio9 | Mean temperature of driest quarter (°C) | 9.8 | 81.1 |
| SLO | Slope (degree) | 6.4 | 87.5 |
| Bio15 | Precipitation seasonality | 5.8 | 93.3 |
| ASP | Aspect (degree) | 3.0 | 96.3 |
| Bio19 | Precipitation of coldest quarter (mm) | 1.2 | 97.5 |
| Bio18 | Precipitation of warmest quarter (mm) | 0.9 | 98.4 |
| FT | Forest type | 0.8 | 99.2 |
| Bio2 | Mean diurnal range/ mean of monthly max. and min. temp. (°C) | 0.8 | 100 |
| Bio14 | Precipitation of driest period (mm) | 0 | 100 |
| Bio17 | Precipitation of driest quarter (mm) | 0 | 100 |
| Bio3 | Isothermality | 0 | 100 |
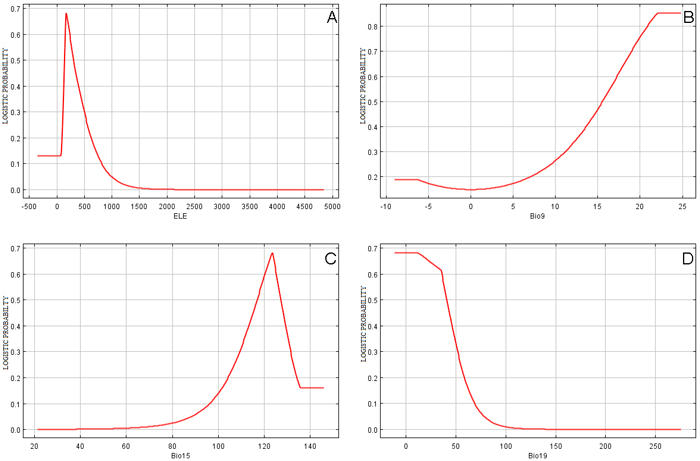
Fig. 4. Relationships between top environmental predictors and the probability of presence of Dalbergia latifolia in Nepal: (A) “ELE” is Elevation in Meter, (B) “Bio9” is Mean temperature of driest quarter in °C, (C) “Bio15” is Precipitation seasonality in mm and (D) “Bio19” is Precipitation of coldest quarter in mm. View larger in new window/tab.
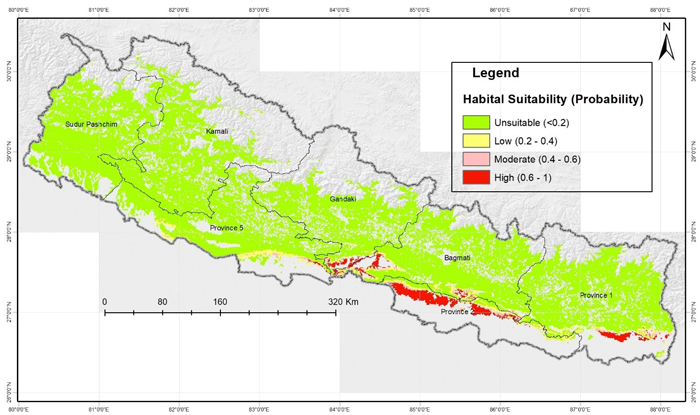
Fig. 5. Predicted potential suitable habitats of Dalbergia latifolia in Nepal using Maxent modelling. View larger in new window/tab.
| Table 3. Predicted potential suitable habitat area of Dalbergia latifolia for different provinces in Nepal. | ||||||||
| Province name | High (0.6–0.8) | Moderate (0.4–0.6) | Low (0.2–0.4) | Unsuitable (<0.2) | ||||
| Area (ha) | Area ratio (%) * | Area (ha) | Area ratio (%) * | Area (ha) | Area ratio (%) * | Area (ha) | Area ratio (%) * | |
| Province-2 | 129 805 | 58.36 | 33 668 | 30.14 | 63 221 | 23.45 | 75 703 | 1.04 |
| Province-1 | 37 560 | 16.89 | 22 017 | 19.71 | 50 807 | 18.85 | 1 307 501 | 17.93 |
| Bagmati | 32 814 | 14.75 | 31 771 | 28.44 | 62 440 | 23.16 | 1 275 727 | 17.49 |
| Gandaki | 19 120 | 8.60 | 9510 | 8.51 | 12 395 | 4.60 | 951 522 | 13.05 |
| Province-5 | 3104 | 1.40 | 14 746 | 13.20 | 80 719 | 29.94 | 1 083 272 | 14.85 |
| Karnali | 0 | 0.00 | 0 | 0.00 | 0 | 0.00 | 1 297 958 | 17.80 |
| Sudur Pashchim | 0 | 0.00 | 0 | 0.00 | 0 | 0.00 | 1 301 748 | 17.85 |
| Grand total | 222 403 | 100.00 | 111 712 | 100.00 | 269 583 | 100.00 | 7 293 430 | 100.00 |
| * Refers to the ratio of predicted area to the corresponding area of habitat suitability type. | ||||||||