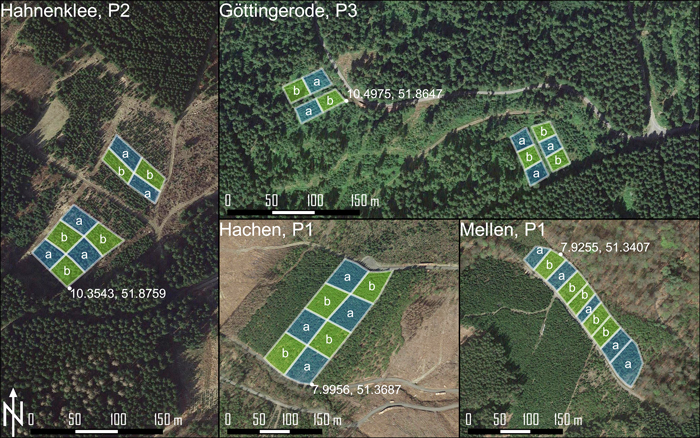
Fig. 1. Pruning and thinning of young stands of Pseudotsuga menziesii were applied at four different sites. Each site was treated by a test person (P1, P2, P3), whereas P1 treated two stands (‘Hachen’ and ‘Mellen’). Two systems were compared: (a) conventional, (b) new. Coordinates given correspond to WGS 84 standard.
| Table 1. Characteristics of pruned Pseudotsuga menziesii trees in the study, on four different stands (site). For pruning, a conventional three-step system (hand-held pruning saw and chainsaw) and a new two-step system (electric pruning shears and ‘Spacer’) were applied. With number of observations (n, trees), mean values, standard deviation (SD), minimum and maximum of diameter at breast height (dbh), tree height and number of branches per tree. | |||||||
| site | system | n | mean | SD | min. | max. | |
| dbh (cm) | Göttingerode | conventional | 71 | 11.7 | 1.98 | 8.2 | 17 |
| new | 62 | 11.4 | 1.92 | 7.9 | 16 | ||
| Hachen | conventional | 40 | 13.3 | 1.99 | 10.0 | 19 | |
| new | 48 | 13.4 | 1.60 | 10.0 | 17 | ||
| Hahnenklee | conventional | 50 | 13.2 | 2.15 | 8.1 | 17 | |
| new | 46 | 13.5 | 1.99 | 10.1 | 18 | ||
| Mellen | conventional | 26 | 10.6 | 2.48 | 7.0 | 15 | |
| new | 35 | 10.9 | 2.19 | 7.0 | 15 | ||
| height (m) | Göttingerode | conventional | 6 | 12.5 | 2.56 | 11.1 | 18 |
| new | 3 | 13.8 | 2.52 | 11.7 | 17 | ||
| Hachen | conventional | 10 | 8.4 | 1.01 | 7.0 | 10 | |
| new | 22 | 9.4 | 1.30 | 7.0 | 12 | ||
| Hahnenklee | conventional | 6 | 15.7 | 2.73 | 11.0 | 18 | |
| new | 6 | 15.2 | 1.84 | 13.0 | 18 | ||
| Mellen | conventional | 6 | 10.8 | 0.76 | 9.5 | 12 | |
| new | 4 | 11.0 | 1.08 | 9.5 | 12 | ||
| quantity of branches | Göttingerode | conventional | 72 | 83.4 | 9.41 | 54.5 | 103 |
| new | 64 | 74.2 | 11.54 | 51.0 | 97 | ||
| Hachen | conventional | 40 | 86.6 | 16.57 | 51.5 | 123 | |
| new | 47 | 90.2 | 16.14 | 58.0 | 130 | ||
| Hahnenklee | conventional | 52 | 86.6 | 11.80 | 64.5 | 115 | |
| new | 46 | 100.1 | 17.06 | 64.0 | 134 | ||
| Mellen | conventional | 25 | 66.1 | 14.13 | 46.5 | 116 | |
| new | 34 | 65.0 | 12.81 | 43.0 | 98 | ||
| Table 2. Test person’s characteristics (heart rate at rest, HRr; estimated maximum heart rate, HRmax) and corresponding study sites. Each person conducted a tending and pruning on young stands of Pseudotsuga menziesii, applying a conventional and a new system. | |||||
| ID | sex | age | HRr | HRmax | study sites |
| P1 | male | 59 | 65 | 161 | ‘Hachen’, ‘Mellen’ |
| P2 | male | 30 | 51 | 190 | ‘Hahnenklee’ |
| P3 | male | 57 | 68 | 163 | ‘Göttingerode’ |
| Table 3. Two systems of pruning (Pseudotsuga menziesii) were compared, the new system using electric pruning shears, the conventional system using hand-held pruning saws. Technical specifications of pruning equipment used and associated costs based on scheduled machine hours (SMH). | |||
| STIHL ASA 85 | INFACO F3015 Medium | Handsaw | |
| max. cutting diameter (mm) | 45 | 45 | – |
| battery | Li-Ion | Li-Ion | – |
| nominal voltage (V) | 36 | 48 | – |
| energy load (Wh) | 1 187 | 120 | – |
| weight incl. battery (kg) | 1.77 | 1.60 | 0.42 |
| retail price, incl. battery and charger (€) | 1 1597.00 | 1713.60 | 66.70 |
| operational costs per unit (€ SMH–1) | 2 2.14 | 2 2.30 | 2 0.04 |
| operational costs, incl. labor (€ SMH–1) | 3 37.64 | 3 37.80 | 3 35.54 |
| 1 AP200 battery pack. 2 estimate based on an economic life of 1500 SMH, over a depreciation period of 5 years (only periodic use in seasonal tending), at common input values for fixed and variable costs in the German forestry sector (Kuratorium für Waldarbeit und Forsttechnik e.V., 2006). 3 fringed operator rate of 35.50 EUR SMH–1. | |||
| Table 4. Technical specifications of felling equipment used for tending of young stands of Pseudotsuga menziesii. With specific costs based on scheduled machine hours (SMH). | ||||
| ‘Spacer‘ | Chainsaws | |||
| Husqvarna 535 FBX | STIHL MS 261 C-M VW | STIHL MS 241 C-M VW | Husqvarna 550XP | |
| bar length (cm) | 33 | 35 | 35 | 38 |
| engine displacement (cm³) | 34.6 | 50.2 | 42.6 | 50.1 |
| nominal power (kW) | 1.6 | 3.0 | 2.3 | 3.0 |
| weight, excl. bar, chain, fuel, lubs (kg) | 12.4 | 5.1 | 4.8 | 5.3 |
| retail price, incl. cutting unit (€) | 1199 | 1057 | 961 | 954 |
| operational costs per unit (€ SMH–1) | 1 6.37 | 2 7.05 | 2 6.86 | 2 7.19 |
| operational costs, incl. labor (€ SMH–1) | 3 41.87 | 3 42.55 | 3 42.36 | 3 42.69 |
| 1 estimate based on an economic life of 1500 SMH, over a depreciation period of 5 years (only periodic use in seasonal tending). 2 estimate based on an economic life of 1500 SMH, over a depreciation period of 3 years (all year use, including designated logging operations). 3 based on input values for fixed and variable costs in the German forestry sector (Kuratorium für Waldarbeit und Forsttechnik e.V., 2006) and a fringed operator rate of 35.50 EUR SMH–1. | ||||
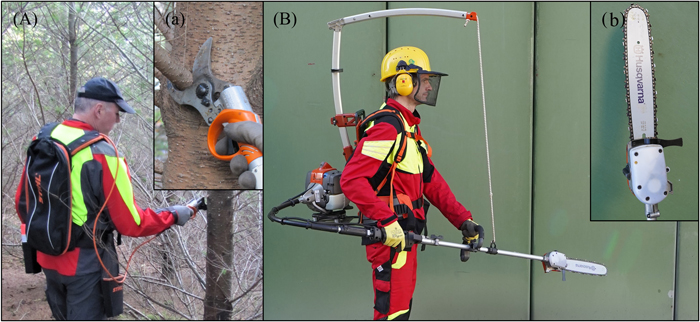
Fig. 2. Equipment used in the new system for pruning and thinning of young stands of Pseudotsuga menziesii. Electric pruning shears Stihl ASA 85 (a) with battery units carried on the back (A) and a clearing saw Husqvarna 535 FBX (‘Spacer’) (B) with a cutting unit with push blade (b).
| Table 5. Defined work elements and applied delay time factors for the time study, observing pruning and tending of young stands of Pseudotsuga menziesii. The work cycle is defined as pruned and exempted future crop tree, and split up into two subcycles, with complementary work time (CWt) and main work time (MWt), according to REFA (2008). | |||||
| Subcycle | Element | Endpoint | REFA Time classification | Delay factor 1 | |
| Work cycle | pruning | search | pruning saw or electric pruning shears touches the branch of the future crop tree for the first cut | CWt | 1.20 |
| cutting | pruning saw or electric pruning shears is placed in the holder | MWt | 1.20 | ||
| marking | spray can is placed in the holder | CWt | 1.20 | ||
| removal | search | chain of the cutting device touches the bark of the competing tree | CWt | 1.20 | |
| saw work | forest operator leaves the contemporary cut tree | MWt | 1.45 (chainsaw), 1.35 (‘Spacer’) | ||
| 1 empirically determined delay factors according to Hittenbeck (2015) were used. | |||||
| Table 6. Summary of total time demand (minutes) for two subcycles: pruning (of future crop trees) and removal (of competing trees) in young stands of Pseudotsuga menziesii. Within the conventional system, handsaw (pruning) and chainsaw (removal) was used, whereas electric pruning shears and a ‘Spacer’, respectively, were used during the new system. Presented are the number of observations (n), mean values, standard deviation (SD) and extreme values (min., max.). | ||||||
| System | Subcycle | n | mean | SD | min. | max. |
| conventional | pruning | 191 | 5.12 | 1.85 | 0.80 | 13.12 |
| removal | 161 | 1.38 | 0.97 | 0.08 | 5.983 | |
| total | 191 | 1 6.09 | 2.37 | 0.55 | 14.38 | |
| new | pruning | 198 | 4.14 | 1.61 | 1.03 | 9.42 |
| removal | 159 | 1.84 | 1.67 | 0.15 | 9.72 | |
| total | 198 | 1 5.48 | 2.68 | 0.20 | 16.70 | |
| 1 Note, that total required work time was less than the sum of its parts, since the quantity of removal activities was lower compared to pruning. | ||||||
| Table 7. Summary of coefficients of the linear mixed effects model fitted to values of: (Model 1) total time demand per tree, (Model 2) total time demand for pruning activities of future crop trees and (Model 3) total time demand for removal of competing trees to adjacent, pruned future crop trees in young stands of Pseudotsuga menziesii for two systems: the conventional and the new one, using hand-held pruning saws and a chainsaw or electric pruning shears and the ‘Spacer’, respectively. | ||||
| Coefficient | Model 1 | Model 2 | Model 3 | |
| Intercept | Estimate | 6.14 | 5.2 | 1.37 |
| Std. Error | 0.9 | 0.63 | 0.35 | |
| df | 3.1 | 3.1 | 3.3 | |
| t value | 6.8 | 8.2 | 3.9 | |
| Pr(>|t|) | 0.006 | <0.001 | 0.025 | |
| newsystem | Estimate | –0.62 | –1 | 0.49 |
| Std. Error | 0.2 | 0.13 | 0.13 | |
| df | 395.1 | 384.1 | 315.5 | |
| t value | –3.2 | –7.5 | 3.7 | |
| Pr(>|t|) | 0.002 | <0.001 | <0.001 | |
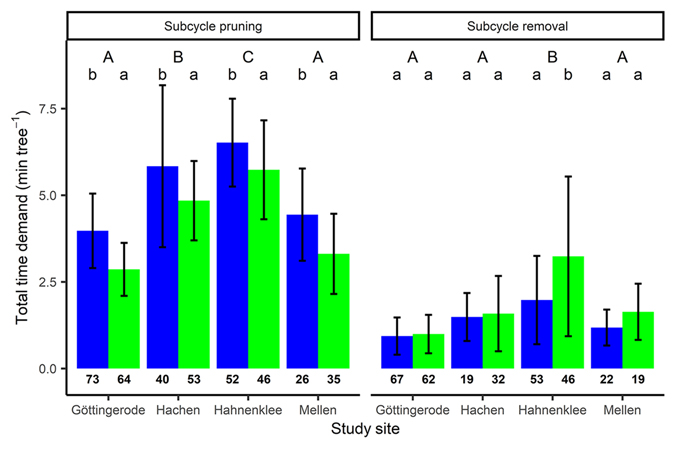
Fig. 3. Mean values (bars) and standard deviation (error bars) of time demand for pruning of future crop trees and removal of competing trees in four stands of young Pseudotsuga menziesii. Blue bars (left) represent the conventional system, green bars (right) the new system. Numbers of observations are given in bold. Small letters indicate significant differences between applied systems, capital letters indicate differences between sites within each subcycle, according to a Tukey-test (p < 0.05).
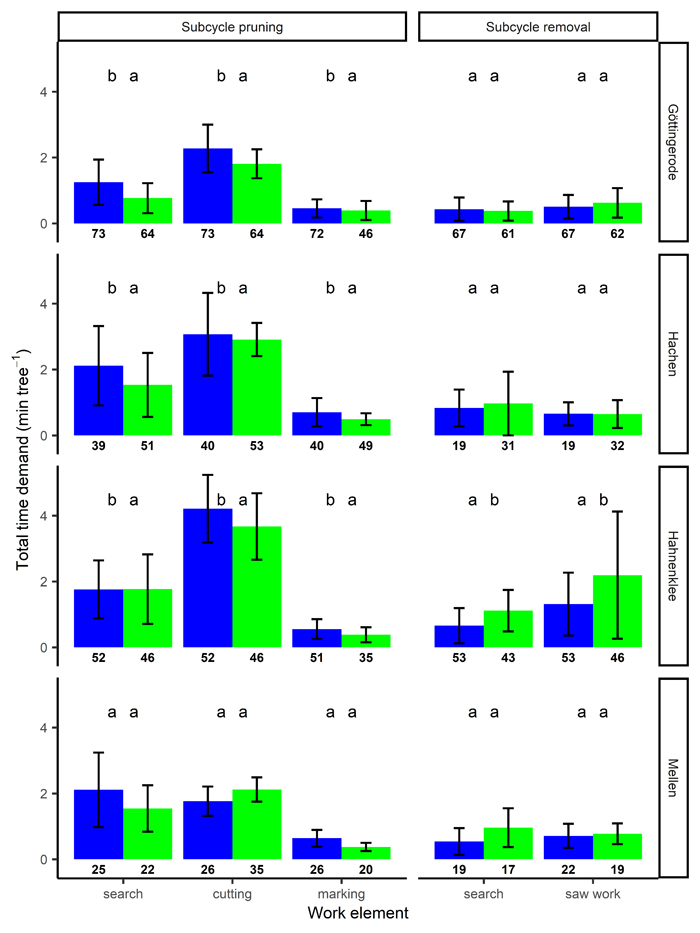
Fig. 4. Mean values (bars) and standard deviation (error bars) of time demand for work elements of the subcycles pruning of future crop trees and removal of competing trees in young Pseudotsuga menziesii stands. Facets depict values of four study sites. Blue bars (left) represent the conventional system, green bars (right) the new system. Numbers of observations are bold. Small letters indicate significant differences between the compared systems, within each subcycle, according to a Tukey-test (p < 0.05).
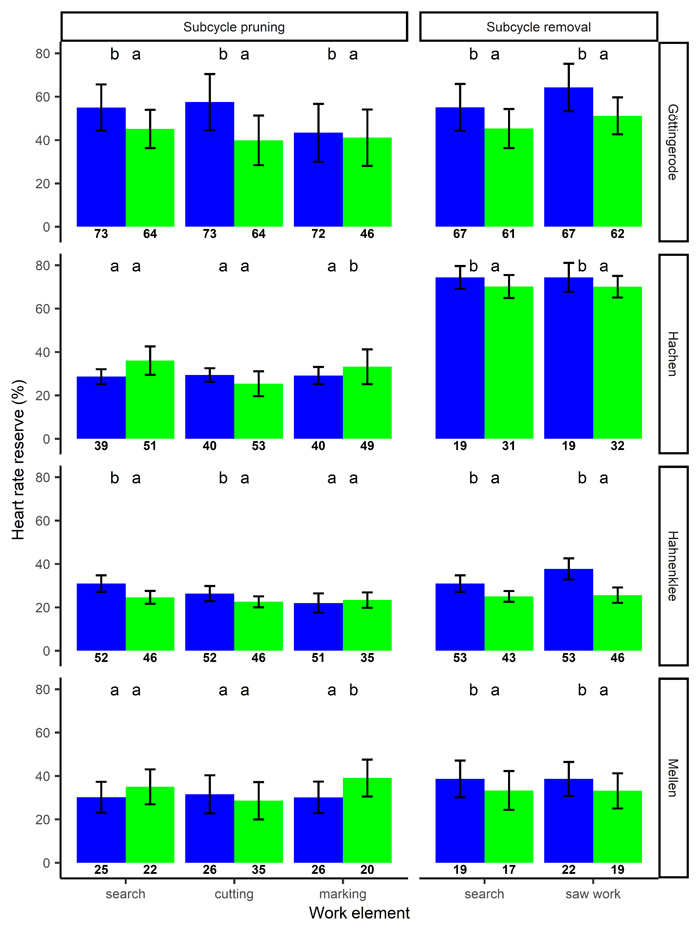
Fig. 5. Mean values (bars) and standard deviation (error bars) of heart rate reserve for work elements of pruning of future crop trees and removal of competing trees in young Pseudotsuga menziesii stands. Facets depict values of four study sites. Blue bars (left) represent the conventional system, green bars (right) the new system. Numbers of observations are bold. Small letters indicate significant differences between the compared systems, within each subcycle, according to a Tukey-test (p < 0.05).