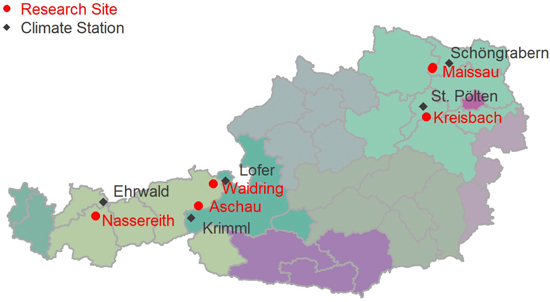
Fig. 1. Locations of intra-annual diameter growth variation research sites in Austria.
| Table 1. Site conditions and coordinates of stand sites to study intra-annual diameter growth variation. | |||||||
| Research Site | Longitude WGS84 1 | Latitude WGS84 1 | Approx. Elevation Stand (m) | Elevation Climate Station (m) | Mean Annual Temp.2 (°C) | Mean Annual Precip.2 (mm) | Geology and Soils |
| Maissau 5 | 15.81 15.80 | 48.57 48.56 | 475 | 253 | 10.1 | 490 | Granite 3 Cambisols |
| Kreisbach 1 | 15.66 | 48.09 | 500 | 274 | 9.5 | 696 | Flysch 3 Planosols |
| Kreisbach 2 | 15.66 | 48.09 | 500 | 274 | 9.5 | 696 | Flysch 3 Planosols |
| Nassereith | 10.82 | 47.27 | 880 | 982 | 6.0 | 1285 | Limestone 4 Rendzic Leptosol, Chromic Cambisols |
| Waidring | 12.51 | 47.55 | 1100 | 622 | 8.3 | 1580 | Werfen strata (Schist and dolomite) 4 |
| Aschau | 12.29 | 47.34 | 1530 | 1009 | 6.2 | 1260 | Quartz phyllit 4 Metamorphic limestone |
| 1 More precise coordinates are given in Suppl. file S8. 2 Climate data was taken from the nearest climate station. 3 Detailed soil assessment available. 4 Derived from geological maps. 5 Two sites with similar conditions were sampled. | |||||||
| Table 2a. Tree species sampled on mixed stands to study annual diameter growth variation. | |||||||
| Research Site | Species | Plot Area (ha) | No. of Trees sampled | Volume (m3 ha–1) | Prop Volume | MAI 2,3 (m3 ha–1 a–1) | Site Index 3 (m) |
| Maissau | Quercus spp. + | 1.75 | 12 | 301 | 0.61 | 5.8 | 24.7 |
| Pinus sylvestris | 12 | 0.31 | 4.5 | 22.6 | |||
| Kreisbach 1 | Picea abies + | 0.49 | 4 | 319 | 0.36 | 15.3 | 37.6 |
| Fagus sylvatica | 8 | 0.50 | 9.9 | 35.2 | |||
| Kreisbach 2 | Larix decidua + | 0.54 | 4 | 860 | 0.15 | 11.8 | 38.9 |
| Fagus sylvatica | 4 | 0.83 | 11.2 | 38.6 | |||
| Nassereith | Pinus sylvestris + | 0.72 | 6 | 549 | 0.35 | 8.0 | 30.0 |
| Picea abies | 6 | 0.19 | 10.0 | 31.5 | |||
| Larix decidua 1 | 6 | 0.20 | 7.5 | 29.1 | |||
| Waidring | Picea abies + | 1.30 | 6 | 467 | 0.69 | 12.6 | 35.2 |
| Abies alba | 6 | 0.13 | 14.2 | 33.7 | |||
| Aschau | Picea abies + | 0.81 | 6 | 507 | 0.37 | 8.9 | 29.6 |
| Larix decidua | 6 | 0.61 | 8.3 | 31.4 | |||
| 1 Larix decidua was sampled in mixed stands with Pinus sylvestris only. 2 MAI is the mean annual volume increment up to an age of 100 years. 3 Site index and MAI: Tree age was obtained from increment cores and 10 years to reach breast height were added. Dominant height was calculated by selecting the 100 largest trees ha–1 (Assmann 1961). In mixed stands the 100 largest trees were selected across species, which avoids underestimation of site index in mixed stands (Zingg 1994). Finally, site index was obtained from Austrian yield tables (Marshall 1975), using the respective regionally recommended yield table. | |||||||
| Table 2b. Tree species sampled on monospecific stands to study annual diameter growth variation. | |||||||
| Research Site | Species | Plot Area (ha) | No. of Trees sampled | Volume (m3 ha–1) | Prop Volume | MAI 3,4 (m3 ha–1 a–1) | Site Index 4 (m) |
| Maissau | Quercus spp. + | 1.14 | 12 | 270 | 0.96 | 5.2 | 23.2 |
| Pinus sylvestris | 0.49 | 12 | 384 | 0.91 | 3.9 | 21.2 | |
| Kreisbach 1 | Picea abies + | 0.62 | 4 | 519 | 0.90 | 17.1 | 39.6 |
| Fagus sylvatica | 0.86 | 8 | 538 | 0.96 | 10.5 | 36.4 | |
| Kreisbach 2 | Larix decidua + | - | 0 | - | - | ||
| Fagus sylvatica | 1.17 | 4 | 738 | 0.94 | 10.7 | 37.0 | |
| Nassereith | Pinus sylvestris + | 0.34 | 6 | 263 | 0.95 | 4.9 | 23.3 |
| Picea abies + | 0.15 | 6 | 544 | 0.77 | 9.16 | 30.1 | |
| Larix decidua 1 | - | 0 | - | - | |||
| Waidring | Picea abies + | 0.20 | 6 | 676 | 0.88 | 13.4 | 36.1 |
| Abies alba 2 | - | 0 | - | - | |||
| Aschau | Picea abies + | 0.42 | 6 | 700 | 0.97 | 10.4 | 32.0 |
| Larix decidua | 1.33 | 6 | 372 | 0.96 | 5.7 | 24.5 | |
| 1 Larix decidua was sampled in mixed stands with Pinus sylvestris only. 2 No samples for Abies alba in monospecific stands are available. 3 MAI is the mean annual volume increment up to an age of 100 years. 4 Site index and MAI: Tree age was obtained from increment cores and 10 years to reach breast height were added. Dominant height was calculated by selecting the 100 largest trees ha–1 (Assmann 1961). In mixed stands the 100 largest trees were selected across species, which avoids underestimation of site index in mixed stands (Zingg 1994). Finally, site index was obtained from Austrian yield tables (Marshall 1975), using the respective regionally recommended yield table. | |||||||
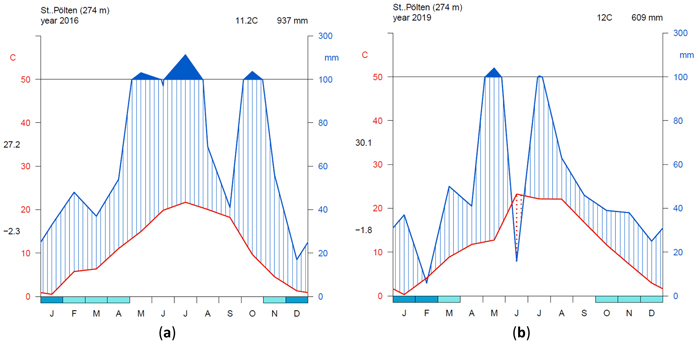
Fig. 2. Climate diagrams after Walter and Lieth (1960) using the function “diagwl” provided by the “Climatol” R-package: (a) Station St. Pölten measuring year 2016; (b) Station St. Pölten measuring year 2019. Mean monthly temperature is plotted on the y-axis and symbolized by a red line. The secondary y-axis shows mean monthly precipitation, which is symbolized by a blue line. Note that when monthly precipitation is greater than 100 mm, the scale is increased from 2 mm °C–1 to 20 mm °C–1 to avoid extremely high y-values in very wet locations. This change is indicated by a black horizontal line, and the graph over it is filled in solid blue. If the temperature line is above the precipitation line, the period is considered dry, which is indicated by red dots on the graph. If the precipitation line is above temperature line, the period is considered humid, which is indicated by blue vertical lines. The blue rectangles for each month on the x-axis indicate the likelihood of frost days. When the average daily minimum is zero or negative, frost certainly occurs and the rectangle is filled with dark blue. If it is zero or positive, the rectangle is filled with a lighter blue to indicate the probability of having frosts in that month. White rectangles indicate months with no frost days. The heading indicates the elevation of the climate station and the mean annual temperature and precipitation of the plotted year. Daily maximum average temperature of the hottest month and daily minimum average temperature of the coldest month are labeled in black at the left margin of the diagram. View larger in new window/tab.
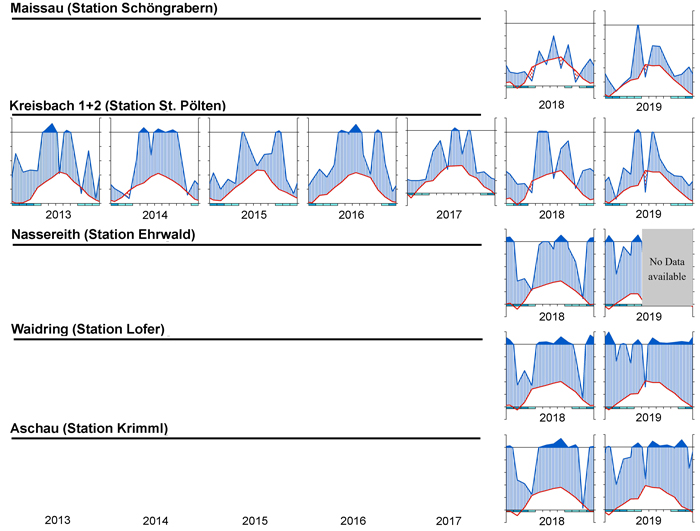
Fig. 3. Climate diagrams after Walter and Lieth (1960) for the nearest climatic station using the function “diagwl” provided by the “Climatol” R-package. Mean monthly temperature is plotted on the y-axis and symbolized by a red line. The secondary y-axis shows mean monthly precipitation, which is symbolized by a blue line. Note that when monthly precipitation is greater than 100 mm, the scale is increased from 2 mm °C–1 to 20 mm °C–1 to avoid extremely high y-values in very wet locations. This change is indicated by a black horizontal line, and the graph over it is filled in solid blue. If the temperature line is above the precipitation line, the period is considered dry, which is indicated by red dots on the graph. If the precipitation line is above the temperature line, the period is considered humid, which is indicated by blue vertical lines. The blue rectangles for each month on the x-axis indicate the likelihood for frost days. When the average daily minimum is zero or negative, frosts certainly occur and the rectangle is filled with dark blue. If it is zero or positive, the rectangle is filled with a lighter blue to indicate the probability of having frosts in that month. White rectangles indicate months with no frost days.
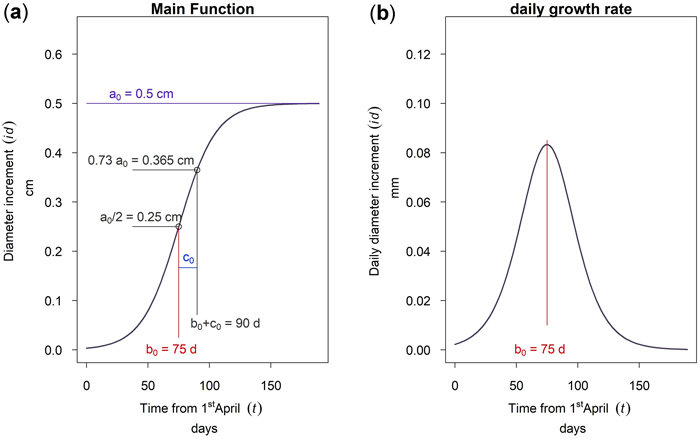
Fig. 4. Function of the 3 parameter logistic model: (a) cumulative dbh growth during the growing season; (b) daily dbh growth rate during the growing season.
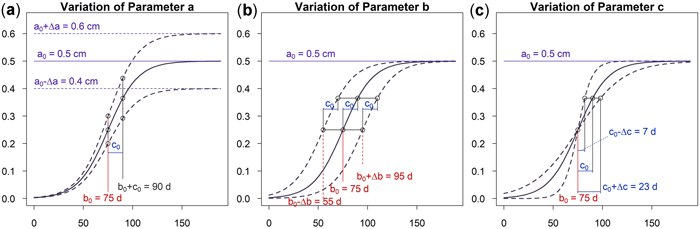
Fig. 5. Effects of the parameters on the cumulative model: (a) Parameter a changes cumulative diameter growth; (b) Parameter b to account for phenological effects; (c) Parameter c to consider the length of growth period. View larger in new window/tab.
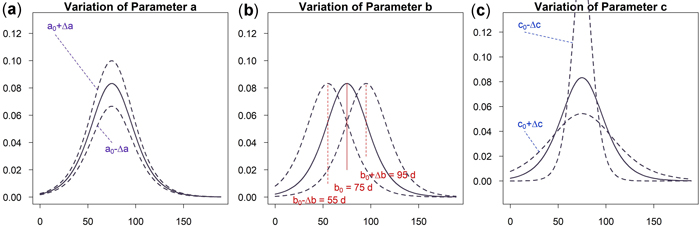
Fig. 6. Effects of the parameter on the daily growth increment: (a) Parameter a to change cumulative and incremental diameter growth; (b) Parameter b to account for phenological effects; (c) Parameter c to consider the length of growth period and vary incremental diameter growth. View larger in new window/tab.
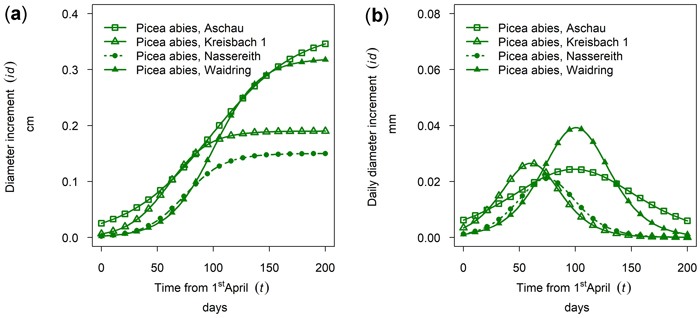
Fig. 7. Growth of mean trees of Picea abies in monospecific stands at different sites in 2019: (a) cumulative dbh growth; (b) daily dbh development. Aschau 1530 m above sea level (a.s.l.), Kreisbach 500 m a.s.l., Nassereith 880 m a.s.l., Waidring 1100 m a.s.l.
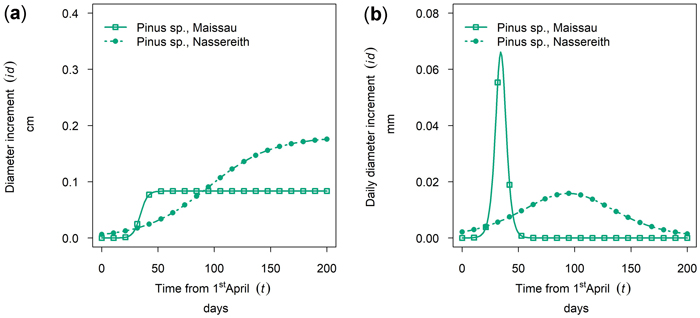
Fig. 8. Growth of Pinus sylvestris in monospecific stands at different sites in 2019: (a) cumulative dbh growth during the growing season; (b) daily dbh development rate during the growing season. Maissau: 450 m above sea level - dry site; Nassreith: 880 m above sea level - humid site.
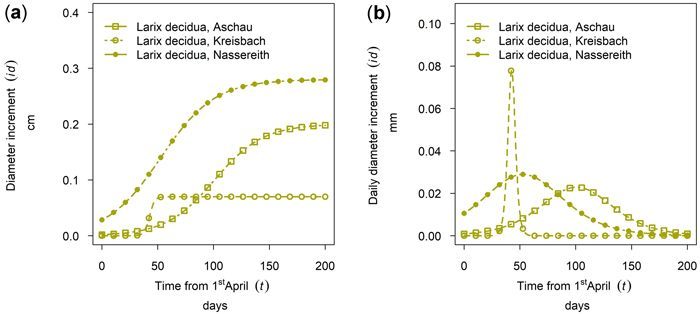
Fig. 9. Growth of Larix decidua in 2019 for 90th percentile (stem diameter) trees at different sites: (a) cumulative dbh growth during the growing season (b) daily dbh development during the growing season. Aschau 1530 m above sea level (a.s.l.), Kreisbach 500 m a.s.l., Nassereith 880 m a.s.l.
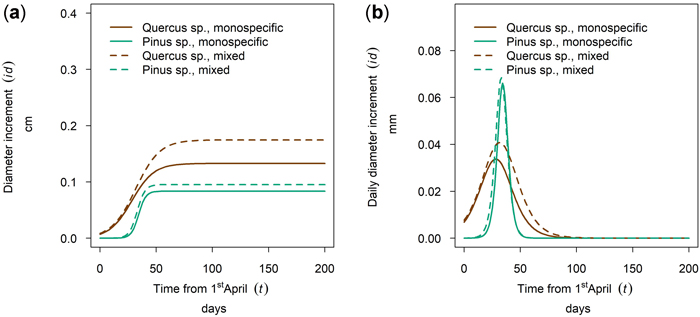
Fig. 10. Modeled growth of Pinus sylvestris and Quercus spp. in mixture and monospecific on a dry low-altitude site: (a) cumulative dbh growth during the growing season 2019; (b) daily dbh development during the growing season 2019.
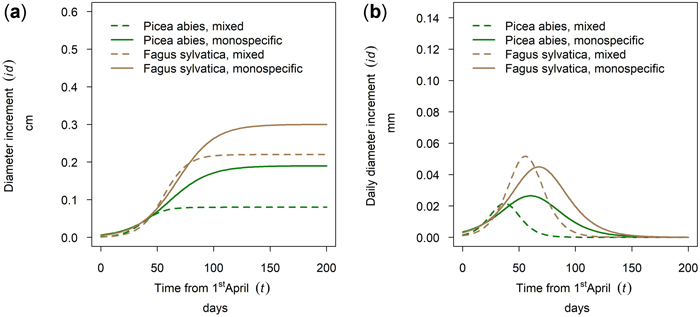
Fig. 11. Modeled growth of Picea abies and Fagus sylvatica in mixture and monospecific stands on a low-altitude site: (a) cumulative dbh growth during the growing season 2019; (b) daily dbh development during the growing season 2019.
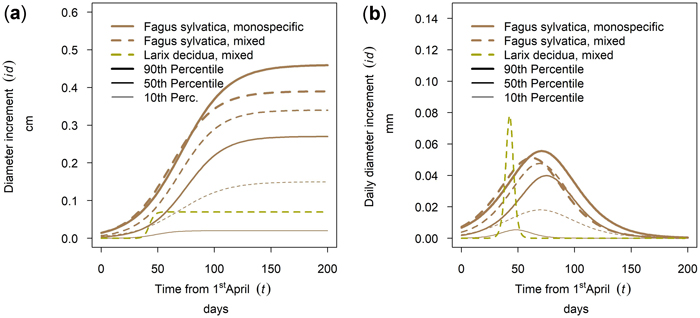
Fig. 12. Modeled growth of Fagus sylvatica in mixture with Larix decidua and in monospecific stands on the low-altitude site Kreisbach: (a) cumulative dbh growth during the growing season 2018; (b) daily dbh development during the growing season 2018.
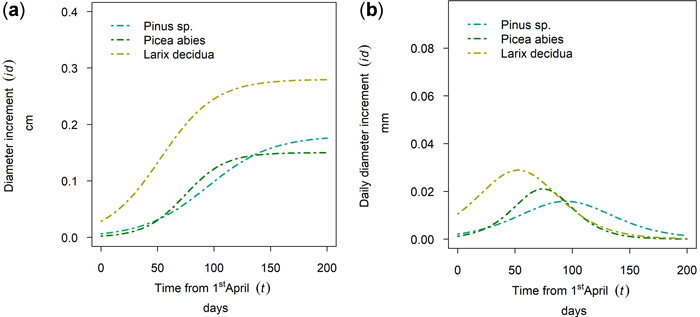
Fig. 13. Modeled growth of Pinus sylvestris, Picea abies and Larix decidua at Nassereith (880 m above sea level): (a) cumulative dbh growth during the growing season; (b) daily dbh development during the growing season.
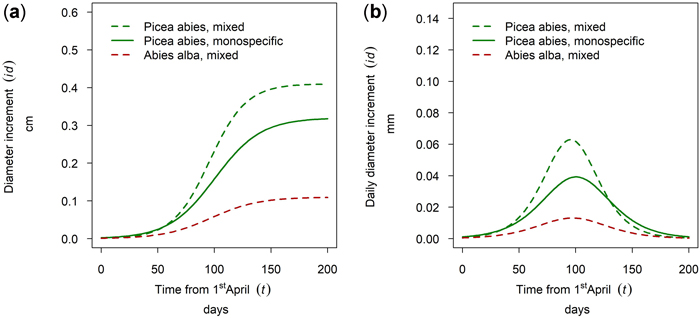
Fig. 14. Modeled growth of Picea abies and Abies alba in mixture and in monospecific stands (P. abies only) on the humid montane site Waidring: (a) cumulative dbh growth during the growing season 2019; (b) daily dbh development during the growing season 2019.
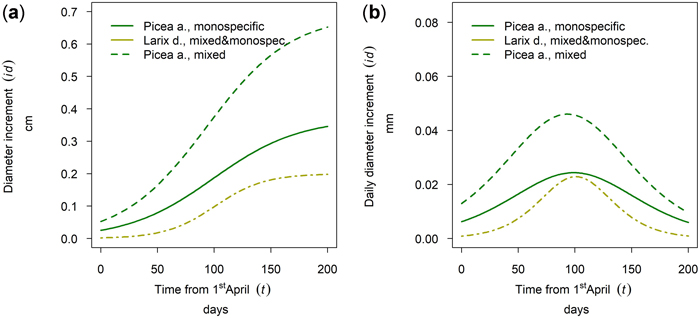
Fig. 15. Modeled growth of Picea abies in mixture and in monospecific stands and Larix decidua (joined evaluation) on the humid high elevation site Aschau: (a) cumulative dbh growth during the growing season 2019; (b) daily dbh development during the growing season 2019.
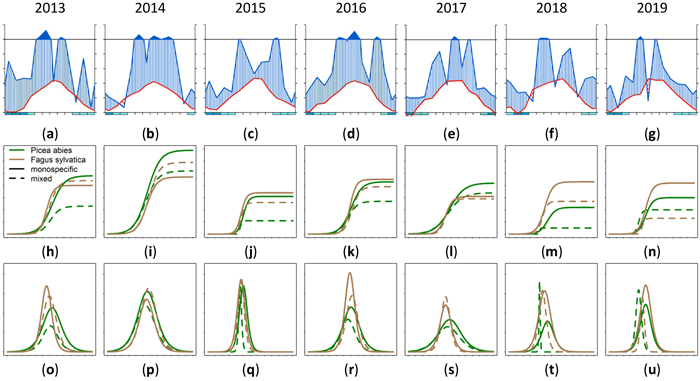
Fig. 16. Modeled growth of 90th percentile of Picea abies and Fagus sylvatica for the years 2013–2019: (a–g) climate graphs (Walter and Lieth 1960); (h–n) annual cumulative dbh growth; (o–u) daily dbh development. Climate diagrams were drawn using the function “diagwl” provided by the “Climatol” R-package. Mean monthly temperature is plotted on the y-axis and symbolized by a red line. The secondary y-axis shows mean monthly precipitation, which is symbolized by a blue line. Note that when monthly precipitation is greater than 100 mm, the scale is increased from 2 mm °C–1 to 20 mm °C–1 to avoid extremely high y-values in very wet locations. This change is indicated by a black horizontal line, and the graph over it is filled in solid blue. If the temperature line is above the precipitation line, the period is considered dry, which is indicated by red dots on the graph. If the precipitation line is above the temperature line, the period is considered humid, which is indicated by blue vertical lines. The blue rectangles for each month on the x-axis indicate the likelihood for frost days. When the average daily minimum is zero or negative, frosts certainly occur and the rectangle is filled with dark blue. If it is zero or positive, the rectangle is filled with a lighter blue to indicate the probability of having frosts in that month. White rectangles indicate months with no frost days. View larger in new window/tab.
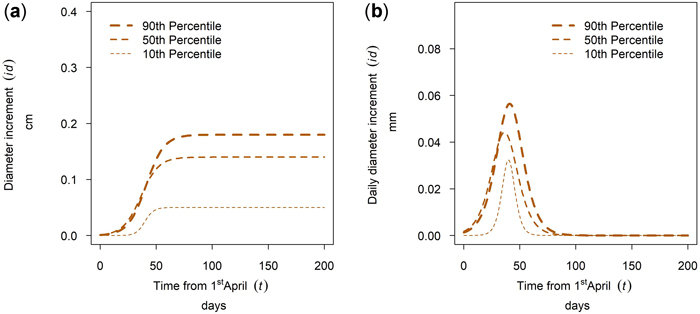
Fig. 17. Modeled intra-annual growth depending on the social position defined as the 10th, 50th and 90th percentile of the diameter distribution of the stands: (a) Cumulative growth of Quercus spp. in year 2018 for the mixed stands in Maissau; (b) Daily dbh development of Quercus spp. in year 2018 for the mixed stands in Maissau.
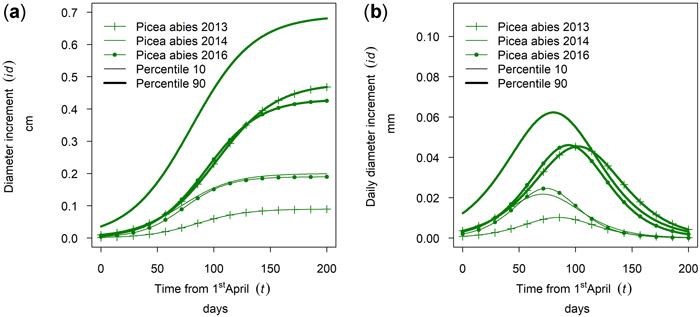
Fig. 18. Modeled intra-annual growth depending on the social position (10th and 90th percentile of the diameter distribution of the stands) and year: (a) Cumulative growth of monospecific Picea abies stands in Kreisbach; (b) Daily dbh development of P. abies in Kreisbach.