| Table 1. The characteristics of the four forest holdings data for an analysis of economic effects on the application of grouse-friendly forest management (GFFM), namely Pori (area, 2067 ha), Kuopio (1061 ha), Pudasjärvi (1278 ha) and Sodankylä (1294 ha). | |||||
| Forest holding (n stands) | Average | St. Dev. | Min. | Max. | |
| Pori (1667) | Scots pine volume (m3 ha-1) | 44.8 | 44.3 | 0.0 | 223.0 |
| Norway spruce volume (m3 ha-1) | 99.4 | 95.9 | 0.0 | 452.0 | |
| Deciduous trees volume (m3 ha-1) | 1.8 | 10.2 | 0.0 | 135.9 | |
| Total volume (m3 ha-1) | 146.1 | 106.0 | 0.0 | 479.5 | |
| Stand age (a) | 47.6 | 24.9 | 0.0 | 130.0 | |
| Kuopio (711) | Scots pine volume (m3 ha-1) | 34.4 | 49.5 | 0.0 | 217.7 |
| Norway spruce volume (m3 ha-1) | 104.2 | 96.6 | 0.0 | 423.7 | |
| Deciduous trees volume (m3 ha-1) | 0.7 | 7.6 | 0.0 | 124.9 | |
| Total volume (m3 ha-1) | 139.3 | 108.9 | 0.0 | 506.9 | |
| Stand age (a) | 38.1 | 20.8 | 0.0 | 101.0 | |
| Pudasjärvi (840) | Scots pine volume (m3 ha-1) | 51.5 | 41.5 | 0.0 | 194.9 |
| Norway spruce volume (m3 ha-1) | 32.2 | 37.8 | 0.0 | 219.2 | |
| Deciduous trees volume (m3 ha-1) | 0.8 | 5.4 | 0.0 | 66.6 | |
| Total volume (m3 ha-1) | 84.5 | 62.4 | 0.0 | 263.8 | |
| Stand age (a) | 66.8 | 37.6 | 0.0 | 172.0 | |
| Sodankylä (568) | Scots pine volume (m3 ha-1) | 33.2 | 34.0 | 0.0 | 164.4 |
| Norway spruce volume (m3 ha-1) | 26.3 | 30.1 | 0.0 | 147.4 | |
| Deciduous trees volume (m3 ha-1) | 1.2 | 3.9 | 0.0 | 33.1 | |
| Total volume (m3 ha-1) | 60.7 | 51.6 | 0.0 | 196.2 | |
| Stand age (a) | 79.5 | 31.9 | 0.0 | 164.0 | |
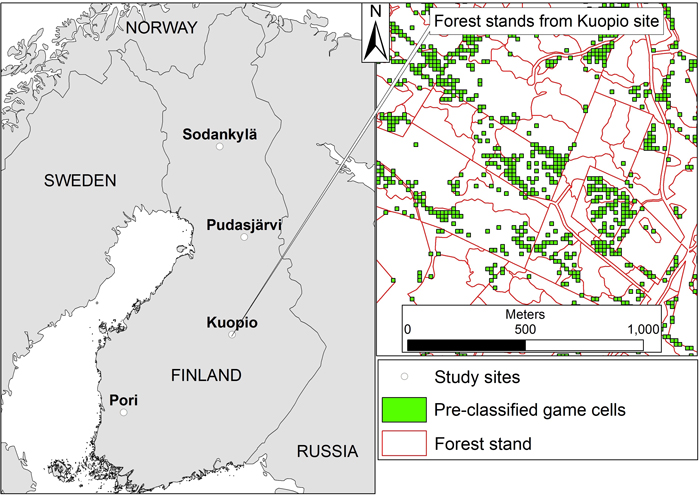
Fig. 1. The location of the four forest holdings in Finland and an example from the Kuopio study area showing the forest stand data from Finnish Forestry Centre overlaid with the pre-classified game cells that according to the definition would be suitable for GFFM. (Sodankylä: 67°10’02.2”N, 26°39’09.1”E, Pudasjärvi: 65°16’27.4”N, 27°52’45.7”E, Kuopio: 63°14’26.2”N, 27°16’11.3”E, Pori: 61°32’02.3”N, 22°29’56.7”E).
| Table 2. The mean stand characteristics and the areas of the normal and intensified stands of the four forest holdings for an analysis of economic effects on the application of GFFM in forest management. | ||||||||
| Pori | Kuopio | Pudasjärvi | Sodankylä | |||||
| Normal | Intensified | Normal | Intensified | Normal | Intensified | Normal | Intensified | |
| Mean stand area (ha) | 1.3 | 0.8 | 1.6 | 0.9 | 1.6 | 0.8 | 2.4 | 1.6 |
| Total volume (m3 ha-1) | 128.8 | 191.1 | 137.4 | 179.4 | 68.2 | 148.5 | 50.5 | 102.3 |
| Scots pine volume (m3 ha-1) | 49.6 | 56.1 | 44.4 | 26.1 | 44.9 | 79.2 | 30.4 | 43.1 |
| Norway spruce volume (m3 ha-1) | 77.2 | 133.3 | 92.8 | 151.6 | 23.2 | 68.1 | 19.3 | 58.0 |
| Deciduous trees volume (m3 ha-1) | 2.0 | 1.7 | 0.1 | 1.8 | 0.1 | 1.2 | 0.8 | 1.1 |
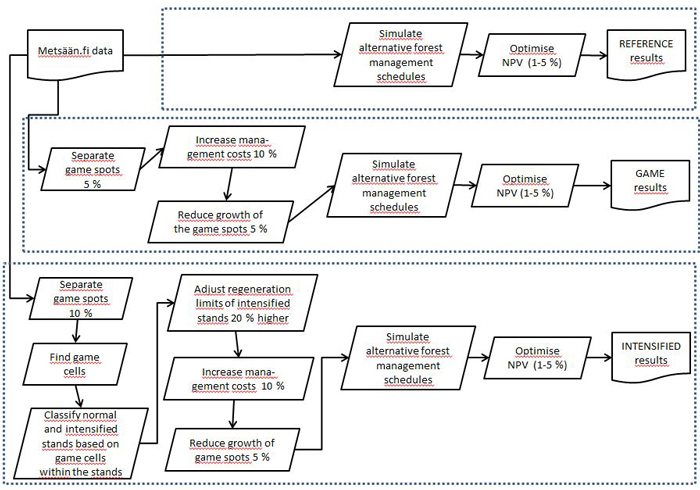
Fig. 2. Flowchart of the simulation process of the three forest management approaches. View larger in new window/tab.
| Table 3. Mean NPV losses (€ ha-1) of the four forest holdings of the alternative GFFM forest management approaches (GAME and INTENSIFIED) with 1, 2, 3, 4 and 5% interest rates in comparison to the REFERENCE forest management approach. Relative NPV losses (%) are in parentheses. | |||||
| 1% | 2% | 3% | 4% | 5% | |
| Pori_GAME | 52.7 (0.15) | 37.4 (0.24) | 28.8 (0.30) | 26.2 (0.36) | 23.3 (0.39) |
| Kuopio_GAME | 54.4 (0.18) | 39.5 (0.27) | 33.6 (0.36) | 29.6 (0.42) | 25.1 (0.42) |
| Pudasjärvi_GAME | 26.3 (0.27) | 20.4 (0.49) | 17.0 (0.63) | 14.9 (0.71) | 13.5 (0.77) |
| Sodankylä_GAME | 21.1 (0.50) | 16.6 (0.87) | 14.0 (1.02) | 12.8 (1.13) | 12.5 (1.26) |
| Pori_INT | 42.0 (0.12) | 52.7 (0.34) | 59.6 (0.61) | 73.1 (1.01) | 93.5 (1.56) |
| Kuopio_INT | -111.7 (-0.37) | 20.1 (0.14) | 87.9 (0.95) | 158.0 (2.23) | 205.9 (3.47) |
| Pudasjärvi_INT | -83.7 (-0.85) | -21.6 (-0.51) | 16.4 (0.61) | 28.3 (1.36) | 32.9 (1.87) |
| Sodankylä_INT | -45.6 (-1.07) | 9.2 (0.48) | 39.3 (2.88) | 54.7 (4.82) | 69.9 (7.02) |
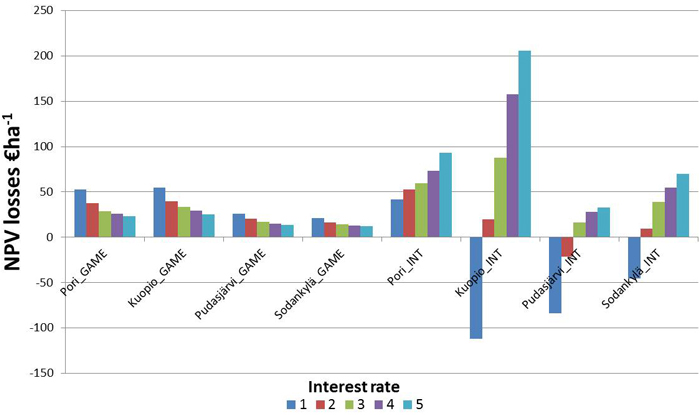
Fig. 3. Mean NPV losses (€ ha-1) of the four forest holdings of the alternative GFFM approaches (GAME and INTENSIFIED) with 1, 2, 3, 4 and 5% interest rates in comparison to the REFERENCE forest management approach.
| Table 4. Proportions of the development classes (%) of the four forest holdings at the beginning of the simulation time (0) and after 30 years simulation at an interest rate of 3% with the REFERENCE approach. In Finland, the forest stands have been categorised by the stage of development into eight classes and the stand-wise guidelines have been defined and applied using the concept (Äijälä et al. 2016). | ||||||||
| Pori | Kuopio | Pudasjärvi | Sodankylä | |||||
| 0 | 30 | 0 | 30 | 0 | 30 | 0 | 30 | |
| Treeless areas and small seedling stands, % | 3.4 | 3.8 | 6.1 | 5.3 | 12.4 | 0.2 | 2.1 | 0.3 |
| Small seedling stands with over story, % | 0.3 | 0.7 | 0.4 | 0.9 | 0.0 | 8.4 | 0.3 | 11.5 |
| Advanced seedling stands with over story, % | 1.8 | 14.3 | 2.5 | 14.1 | 0.1 | 19.1 | 0.0 | 31.2 |
| Advanced seedling stands, % | 11.5 | 0.7 | 15.3 | 1.3 | 5.9 | 3.0 | 4.8 | 1.8 |
| Young thinning stands, % | 16.9 | 10.6 | 15.0 | 16.9 | 23.5 | 15.7 | 19.1 | 7.0 |
| Advanced thinning stands, % | 42.0 | 23.9 | 49.4 | 23.6 | 23.5 | 17.7 | 19.7 | 6.7 |
| Mature stands, % | 23.9 | 45.5 | 11.3 | 37.3 | 34.6 | 35.9 | 53.9 | 41.5 |