| Table 1. Bayesian binary logistic generalized linear mixed-effect model estimates of tree- and stand-scale variables on the probability of wind damage for birch. For the variables with several levels, the estimate is the difference from the reference level. Data obtained from National Forest Inventory in Latvia. | ||||
| Variable | Estimate | Est.error | CI | |
| Min | Max | |||
| Intercept | −5.03 | 0.27 | −5.68 | −4.62 |
| Stand age (years)* | 0.39 | 0.07 | 0.26 | 0.53 |
| Dominant tree species (reference level: birch)*: | ||||
| Pine | −0.45 | 0.17 | −0.78 | −0.13 |
| Spruce | 0.08 | 0.16 | −0.25 | 0.39 |
| Black alder | 0.22 | 0.23 | −0.25 | 0.69 |
| Aspen | 0.17 | 0.21 | −0.24 | 0.57 |
| Grey alder | −0.13 | 0.45 | −1.08 | 0.69 |
| Oak | 0.08 | 0.77 | −1.54 | 1.47 |
| Ash | 0.06 | 0.70 | −1.42 | 1.31 |
| Goat willow | −0.39 | 1.31 | −3.48 | 1.71 |
| Stand density (trees ha–1)* | −0.70 | 0.11 | −0.92 | −0.50 |
| Overstory basal area (m2 ha–1)* | 0.21 | 0.07 | 0.08 | 0.34 |
| Management (reference level: not thinned in the last 5 years): | ||||
| Thinned in the last 5 years | 0.17 | 0.17 | −0.16 | 0.49 |
| Site type (reference level: dry mineral soil)*: | ||||
| Wet mineral soil | 0.00 | 0.20 | −0.41 | 0.40 |
| Peat soil | 0.75 | 0.20 | 0.36 | 1.14 |
| Drained wet mineral soil | 0.32 | 0.15 | 0.03 | 0.60 |
| Drained peat soil | 0.94 | 0.15 | 0.65 | 1.24 |
| Slenderness ratio* | 0.39 | 0.04 | 0.30 | 0.47 |
| Prior damage (reference level: not damaged)*: | ||||
| Damaged | 1.46 | 0.15 | 1.18 | 1.79 |
| Est.error – standard deviation of posterior distribution; CI – 95% credible interval; * – significant effect according to 95% credible interval; Birch – Betula pendula and B. pubescens; Pine – Pinus sylvestris; Spruce – Picea abies; Black alder – Alnus glutinosa; Aspen – Populus tremula; Grey alder – Alnus incana; Oak – Quercus robur; Ash – Fraxinus excelsior; Goat willow – Salix caprea | ||||
| Table 2. The tested tree- and stand-scale variables used to determine the probability of wind damage on birch by Bayesian binary logistic generalized linear mixed. The number of observations is noted for categorical variables and mean ± standard deviation (SD) is noted for continuous variables. Data obtained from National Forest Inventory in Latvia. | ||||
| Variable | Description | Classes/ Range | Number of observations/ Mean ± SD | |
| 2004–2008 | 2009–2013 | |||
| Age | Stand age, years | 11–216 | 56.6 ± 20.9 | 58.1 ± 21.8 |
| Growing stock | Mean standing volume, m3 ha–1 | 16–850 | 270 ± 127 | 281 ± 136 |
| Species | Dominant tree species | Birch | 6639 | 7161 |
| Pine | 1825 | 1869 | ||
| Spruce | 1333 | 1334 | ||
| Black alder | 627 | 657 | ||
| Aspen | 793 | 787 | ||
| Grey alder | 398 | 341 | ||
| Oak | 47 | 47 | ||
| Ash | 63 | 25 | ||
| Goat willow | 36 | 52 | ||
| Stand density | Overstory number of trees, trees ha⁻¹) | 100–11 520 | 1145 ± 875 | 1112 ± 906 |
| Basal area | Overstory basal area, m2 ha–1 | 3–67 | 27.2 ± 9.9 | 27.8 ± 10.2 |
| Management | Harvesting operations in the last five years | Thinned | 1800 | 721 |
| Not thinned | 9974 | 11 571 | ||
| Site type | Site types grouped according to soil conditions | Dry mineral soil | 4718 | 4804 |
| Wet mineral soil | 1374 | 1370 | ||
| Peat soil | 1058 | 1345 | ||
| Drained mineral soil | 2462 | 2434 | ||
| Drained peat soil | 2162 | 2339 | ||
| Slenderness ratio | Height (m) to diameter at breast height (cm) ratio | 0.3–1.9 | 1.0 ± 0.2 | 1.0 ± 0.2 |
| Prior damage | Stem or root-stump damage in the previous measuring period | Not damaged | 11 303 | 11 572 |
| Damaged | 471 | 720 | ||
| Birch – Betula pendula and B. pubescens; Pine – Pinus sylvestris; Spruce – Picea abies; Black alder – Alnus glutinosa; Aspen – Populus tremula; Grey alder – Alnus incana; Oak – Quercus robur; Ash – Fraxinus excelsior; Goat willow – Salix caprea | ||||
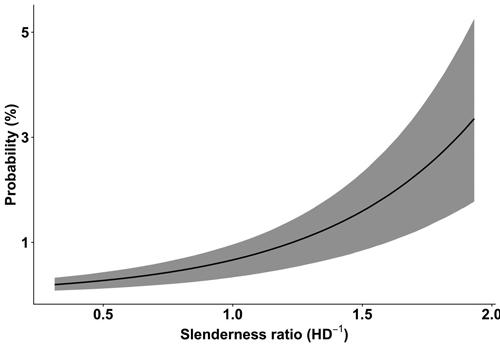
Fig. 1. The probability of wind damage to birch (Betula pendula and B. pubescens) in relation to the slenderness ratio (height (m) to the diameter at breast height (cm) ratio, HD–1), based on Latvian National Forest Inventory data. The 95% credible interval is represented by the grey area.
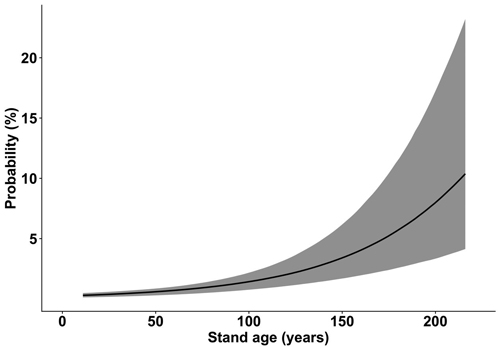
Fig. 2. The probability of wind damage to birch (Betula pendula and B. pubescens) in relation to the age of dominant tree species in a stand, based on Latvian National Forest Inventory data. The 95% credible interval is represented by the grey area.
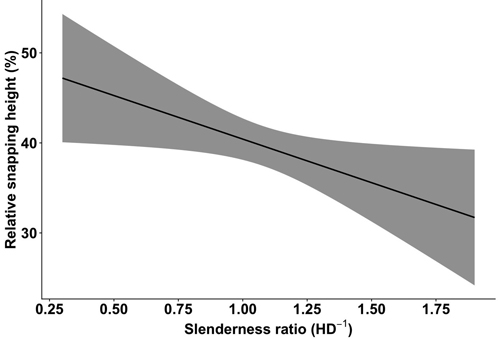
Fig. 3. The relative snapping height of birch (Betula pendula and B. pubescens) in relation to the slenderness ratio (height (m) to the diameter at breast height (cm) ratio, HD–1), based on Latvian National Forest Inventory data. The 95% confidence interval is represented by the grey area.
| Table 3. Generalized linear mixed-effects model estimates of slenderness ratio (HD–1), prior damage, and crown height (h-crown) effects on relative snapping height for birch. Data obtained from National Forest Inventory in Latvia. | ||||
| Variable | Estimate | SE | t-value | p-value |
| Intercept | 0.532 | 0.048 | 10.98 | <0.001 |
| HD–1 | −0.097 | 0.044 | −2.18 | 0.03 |
| h-crown (m) | 0.001 | 0.003 | −0.49 | 0.06 |
| Prior damage (Damaged vs Not damaged) | −0.090 | 0.030 | −2.98 | 0.003 |
| SE = standard error | ||||
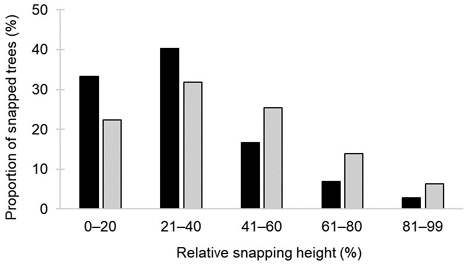
Fig. 4. The proportion of snapped birch trees (Betula pendula and B. pubescens) according to relative snapping height groups for previously damaged (black bars) and previously undamaged (light grey bars) trees, based on Latvian National Forest Inventory data.