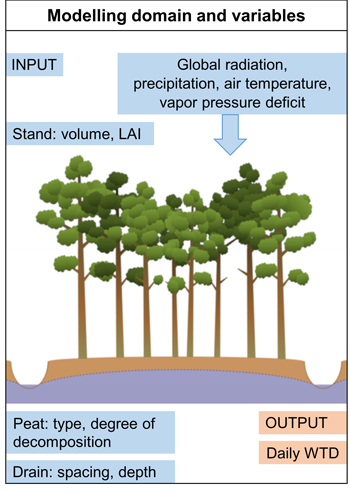
Fig. 1. SUSI model computes water storages and fluxes between two parallel ditches. SUSI calculates in daily time step water interception into canopy and ground vegetation, interception evaporation, transpiration, infiltration into soil, water table depth, and horizontal water movement to the ditches. Required meteorological inputs are global radiation, precipitation, air temperature and vapor pressure deficit. Output is daily WTD at different distances from ditch.
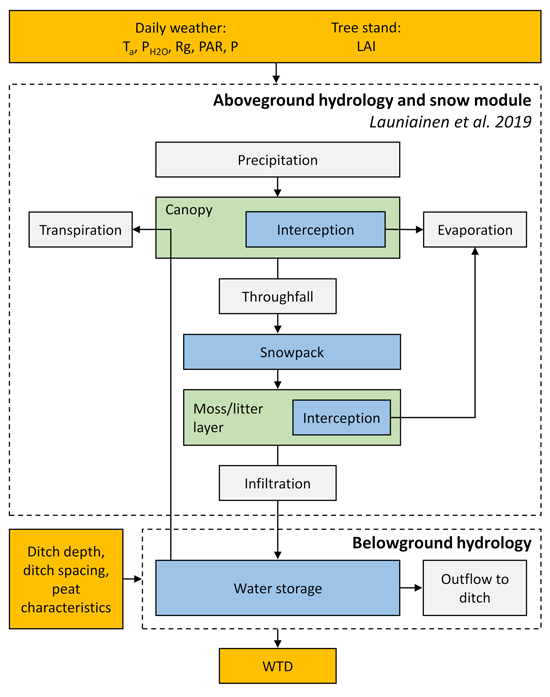
Fig. 2. Flowchart and components of the hydrological part of SUSI model. SUSI is modular and the source code is available at https://github.com/annamarilauren/susi. The repository also contains test input data for running the model.
| Table 1. Stand characteristics and leaf area index (LAI) of the simulated Scots pine drained peatland forests ranging from the clear-cut stage to near mature stands. LAI at clear-cut stage represent ground vegetation. | ||
| Stand volume, m3 ha–1 | Dominant height, m | Stand LAI, m2 m–2 |
| 0 | 0 | 0.5 |
| 45 | 7.5 | 1.7 |
| 90 | 10.0 | 2.3 |
| 130 | 14.5 | 2.8 |
| 175 | 16.5 | 3.0 |
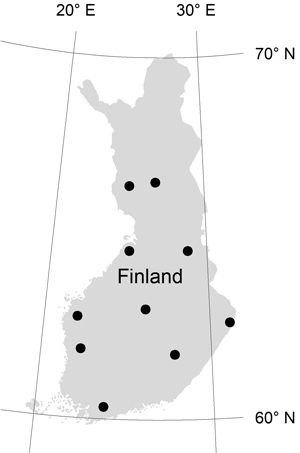
Fig. 3. Locations where SUSI was applied in the simulated scenarios.
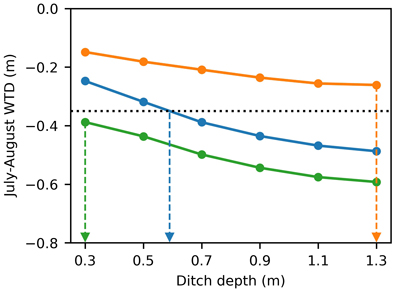
Fig. 4. Estimation of the effective ditch depth with 0.35 m target WTD in three examples. If target is not reached with 1.3 m ditch depth, the effective depth is set to 1.3 m (orange line). If target is reached with ≤0.3 m deep ditch, the effective depth is assigned as 0.3 m (green line).
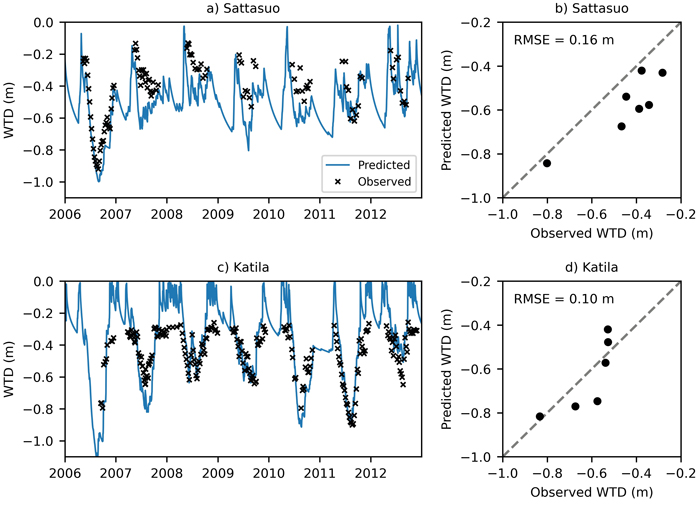
Fig. 5. Testing the model against manually measured WTD data for seven years for a–b) Sattasuo (Rovaniemi, northern Finland) and c–d) Katila (Tuusula, southern Finland). Peat type is Carex in Sattasuo and Sphagnum in Katila. Peat profile P2 was used in the simulations in both sites. In Sattasuo, measured data includes 50 groundwater tubes. In Katila, there were 35 groundwater tubes. Modeled and daily mean values of the measured WTD levels are presented in the figures a and c. Comparison of predicted and observed July–August mean WTD is presented in the figures b and d.
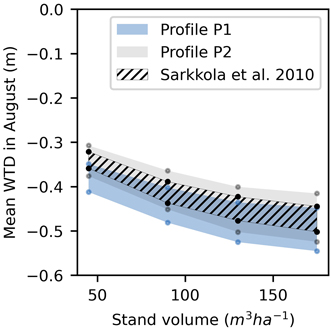
Fig. 6. Comparison of the predicted mean August WTD and the statistical model by Sarkkola et al. (2010). The comparison includes all 10 climatic locations (see Fig. 3) with Carex peat, 0.5 m ditch, and 40 m ditch spacing. The shaded or hatched area represents the range in simulated climatic locations.
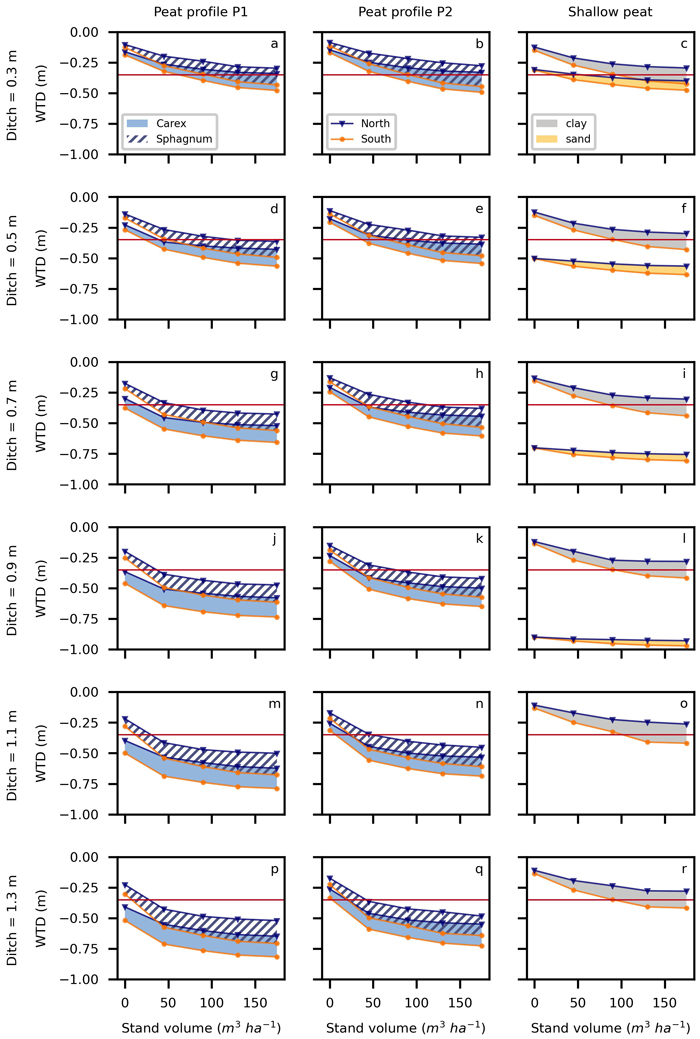
Fig. 7. Median of July–August WTDs (m) for different peat profiles (P1, P2 and shallow peat) with various ditch depths and stand volumes with ditch spacing of 40 m. The shaded or hatched area represents the range in simulated climatic conditions; the lower limit (orange dots) represents the southernmost and upper limit (blue triangles) represents the northernmost climate. In subfigures o and r, the WTD for sand subsoil profile falls below –1 m and is thus not shown. The red lines mark the –0.35 m WTD.
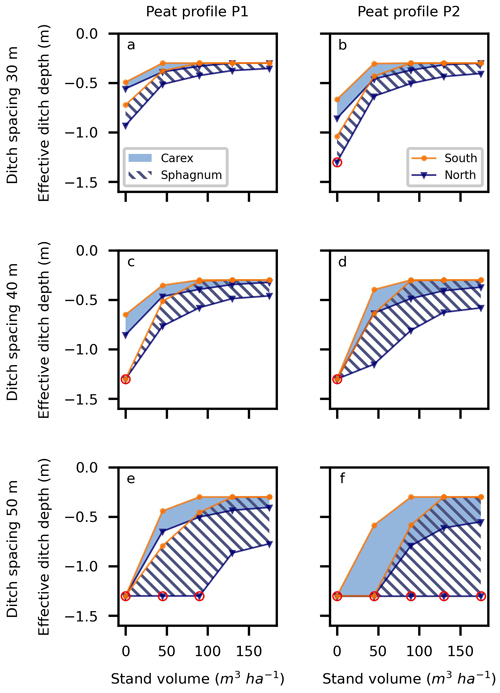
Fig. 8. The effect of peat profile (P1, P2), peat type, ditch spacing, and stand volume on effective ditch depths. Shaded or hatched area represent the range in effective ditch depths within the simulated climates, northernmost representing its lower part (blue triangles), and southernmost the upper part (orange dots). Effective ditch depths are limited between –0.3 m and –1.3 m. Target WTD (0.35 m) is not reached with the effective depths that are marked with red circle.