| Table 1. Mean, minimum (Min), maximum (Max) and standard deviation (SD) for variables describing the 52 thinned and unthinned periods from the silver birch experiments used in this study. Variables: BA is basal area; H0 is the dominant height; SI is site index – the mean height of the 100 thickest trees per hectare at 50 years. | ||||||||
| Variable | Unthinned (n = 301) | Thinned (n = 380) | ||||||
| Mean | Min | Max | S.D. | Mean | Min | Max | S.D. | |
| t (years) | 21 | 7 | 63 | 11 | 22 | 11 | 59 | 9 |
| N (trees ha–1) | 1506 | 302 | 2850 | 718 | 987 | 342 | 2160 | 387 |
| BA (m2 ha–1) | 12.8 | 1.0 | 56.3 | 8.7 | 15.4 | 4.4 | 50.5 | 6.4 |
| H0 (m) | 14.7 | 5.0 | 24.5 | 4.6 | 15.5 | 8.3 | 23.5 | 3.2 |
| SI (m) | 24.5 | 11.7 | 31.6 | 3.6 | 23.9 | 12.9 | 29.7 | 4.0 |
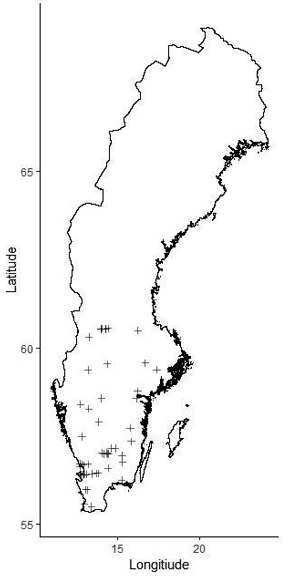
Fig. 1. Location of the silver birch study sites in Sweden.
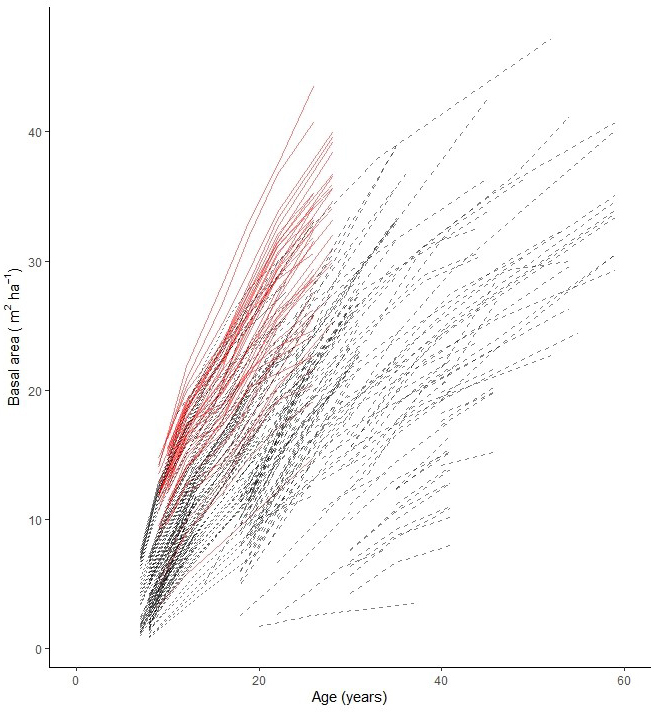
Fig. 2. Stand basal area growth data used for modelling basal area development of planted silver birch in Sweden. Experiments on former agriculture land are shown with solid (red) lines and on forest sites with dashed (black) lines.
| Table 2. Base models and Generalized Algebraic Difference Approach (GADA) forumulations selected for basal area development of silver birch. View in new window/tab. |
| Table 3. Parameter estimates of initial conditions in the stand values of silver birch. SE is standard error, t-values and p-values demonstrate the statistical performance of the parameters. The model is based on a dependent variable of logarithmically transformed basal area for stands between 7 and 12 years old and several independent variables: age (years), quadratic square root-transformed number of trees (N ha–1) and site index (SI) at 50 years (Johansson et al. 2013). | ||||
| Estimate | SE | t-value | p-value | |
| Intercept | –7.3193 | 0.8710 | –8.40 | 3.19e–14 |
| Age (years) | 0.2138 | 0.0151 | 14.11 | 2e–16 |
| (N ha–1) | 0.0643 | 0.0188 | 3.42 | 0.000814 |
| Site index (m) | 0.1555 | 0.0152 | 10.23 | < 2e–16 |
| Table 4. Parameter estimates for the model converting basal area into volume for silver birch. The dependent variable is a ratio between total volume production and total basal area production. Independent variables are top height (m) and age (years). SE is standard error, t-values and p-values demonstrate the statistical performance of the parameters. | ||||
| Estimate | SE | t-value | p-value | |
| Intercept | –0.4044 | 0.063 | –6.45 | <0.05 |
| Top height (m) | 0.4286 | 0.006 | 75.2 | <0.05 |
| Age (years) | 0.0085 | 0.002 | 3.65 | <0.05 |
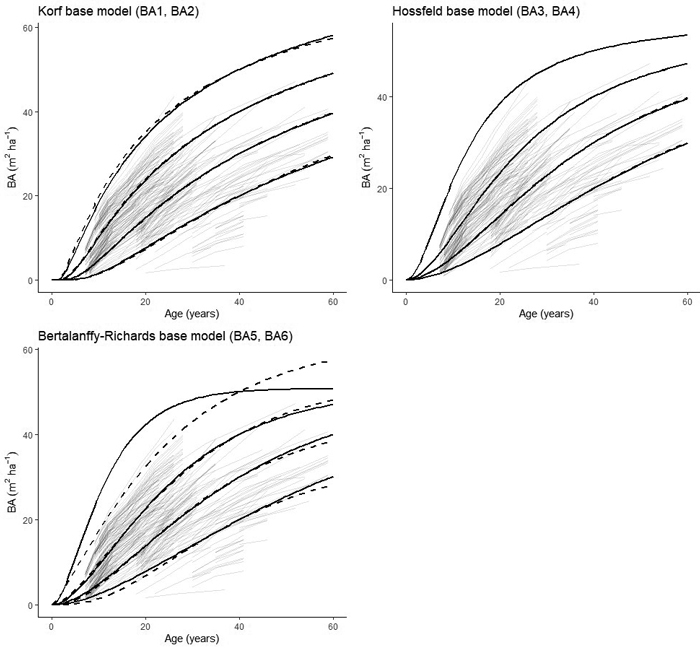
Fig. 3. Basal area development curves of silver birch reaching basal areas of 15, 25, 35 and 45 m2 ha–1 at 40 years for the two-parameter models (BA1, BA3, BA5 – solid lines) and the three parameter models (BA2, BA4, BA6 – dashed lines).
| Table 5. Parameter estimates, standard errors (SE), and goodness-of-fit measurements (P = level of statistical significance, RMSE = root mean square error, R2 = coefficient of determination) for the dynamic equations for basal area development of silver birch considered in this study. | ||||||
| Base model | Parameter | Estimate | SE | P | RMSE | R2 |
| Korf (BA1) | b1b2 | 91.3397 0.7054 | 6.2864 0.0296 | <0.0001 <0.0001 | 1.569 | 0.9724 |
| Korf (BA2) | b1b2b3 | 506.8 –1900 0.5985 | 325.0 1472 0.302 | 0.119 0.127 <0.0001 | 1.568 | 0.9726 |
| Hossfeld (BA3) | b1b2 | 57.1328 1.7511 | 2.1663 0.04 | <0.0001 <0.0001 | 1.754 | 0.9656 |
| Hossfeld (BA4) | b1b2b3 | 59.1606 –552.77 –1.7460 | 3.4204 851.43 0.03987 | <0.0001 0.516 <0.0001 | 1.755 | 0.9656 |
| Bertalanffy-Richards (BA5) | b1b2 | 50.7827 1.9404 | 1.5410 0.0615 | <0.0001 <0.0001 | 1.7522 | 0.9351 |
| Bertalanffy-Richards (BA6) | b1b2b3 | 0.0458 –10.2369 47.6122 | 0.0022 2.1422 8.2858 | <0.0001 <0.0001 <0.0001 | 1.663 | 0.9691 |
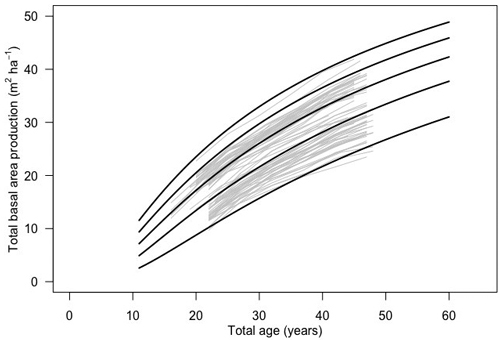
Fig. 4. Basal area development of silver birch in 12 thinning experiments in Finland (gray lines) and basal area development according to the Korf function (BA1; black lines).
| Table 6. Results of the simulation for silver birch stands established with planting material with site indices of 22 m, 25 m and 28 m at 50 years. Initial stand density is 2200 trees ha–1 at 10 years. Three thinnings (including one non-commercial cleaning and two commercial thinnings) with removal of 30% of basal area were applied in each stand. Land expectation value (LEV) based on a 2.5% discount rate was applied. | |||||
| Site index | Mean annual increment | Land expectation value | Rotation length | Harvested volume | |
| Thinning | Final felling | ||||
| (m) | (m3 ha–1 year) | (EUR ha–1) | (years) | (m3 ha–1) | (m3 ha–1) |
| 22 | 6.0 | 479.6 | 60 | 93 | 269 |
| 25 | 7.9 | 1511.7 | 51 | 66 | 337 |
| 28 | 10.5 | 3103.2 | 45 | 80 | 394 |
| 32 | 12.8 | 5500.8 | 31 | 108 | 287 |
| Table 7. Relative differences between silver birch genotype German 2 and other silver birch genotypes for height (H), diameter (D), top height (TH), site index (SI), basal area (G) and volume (V). The number indicate an age when the trait was measured. | ||||||||
| Origin | H_9 | D_9 | G_9 | V_9 | TH_9 | SI_26 | G26 | V_26 |
| E-län (Sweden) | 120% | 108% | 124% | 140% | 117% | 107% | 113% | 132% |
| Ekebo 1 (Sweden) | 125% | 118% | 153% | 180% | 126% | 110% | 155% | 183% |
| Finland 1 | 115% | 110% | 128% | 140% | 112% | 105% | 125% | 137% |
| Finland 2 | 133% | 115% | 144% | 179% | 127% | 111% | 136% | 162% |
| Holland | 130% | 117% | 148% | 179% | 118% | 108% | 103% | 110% |
| Latvia | 127% | 121% | 157% | 186% | 128% | 112% | 146% | 175% |
| Mixed | 108% | 107% | 89% | 95% | 115% | 107% | 100% | 117% |
| T-län | 131% | 125% | 170% | 206% | 136% | 115% | 188% | 252% |
| German 1 | 111% | 121% | 132% | 137% | 113% | 106% | 123% | 136% |
| German 2 | 100% | 100% | 100% | 100% | 100% | 100% | 100% | 100% |
| Average (1:9) | 122% | 116% | 138% | 160% | 121% | 109% | 132% | 156% |
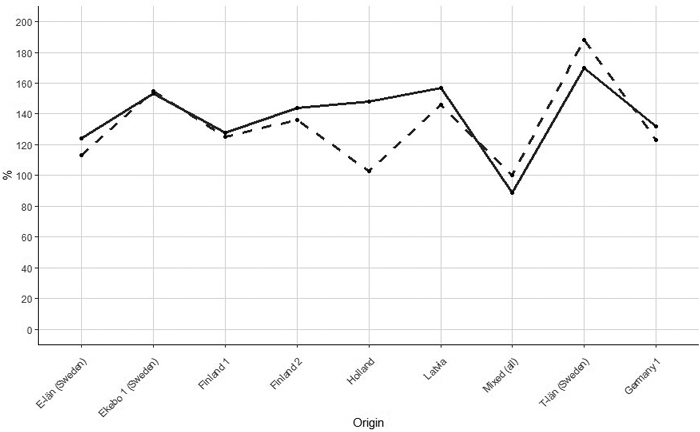
Fig. 5. Relationship between relative difference in basal area of silver birch between genotype German 2 and other genotypes in the age of 9 years (solid line) and 26 years (dashed line). Correlation between relative difference in age 9 years and 27 years was 0.77 (German 2 was excluded).