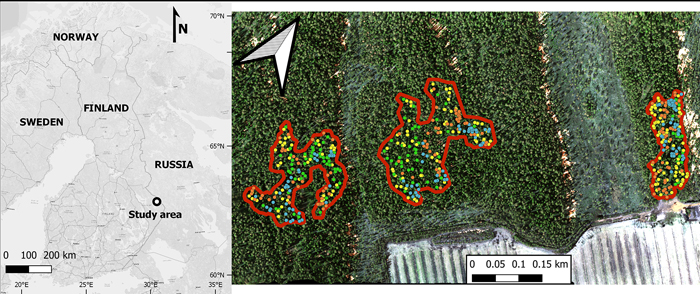
Fig. 1. The location of the study area (Jyrinvaara) in Finland (left), and a zoomed in view (right) of this protected area. Within the protected area, there are three old-growth forest parts containing European aspen that are outlined in red. The various colored dots represent the various tree species (green for European aspen, yellow for birches [both silver and downy birch], blue for Norway spruce, and orange for Scots pine).
| Table 1. The reference trees for the training and validation of the remotely sensed models for aspen detection. The total number of trees per tree species and various diameter at breast height (dbh) measures are only available for the field-inventoried tree species. Birches refers to silver and downy birch. | |||||
| Tree species | Number of trees | Mean dbh (cm) | Minimum dbh (cm) | Maximum dbh (cm) | Data source |
| European aspen | 106 | 41 | 25 | 65 | Field |
| Birches | 160 | 28 | 17 | 44 | Field |
| Norway spruce | 122 | - | - | - | Visual interpretation |
| Scots pine | 122 | - | - | - | Visual interpretation |
| Table 2. Characteristics of the multispectral and RGB drone image data sets collected from our study area for aspen detection. | ||||||
| Date | Type | No. of images | Image overlap | Aspen developmental stage | Birch developmental stage | Weather condition |
| 13 May 2019 | Multispectral | 1339 | 80/75 | Leaf off | Late leaf flush | Sunny |
| 22 May 2019 | Multispectral | 1485 | 85/85 | Early leaf flush | Mature leaves | Overcast |
| 30 May 2019 | Multispectral | 1685 | 85/85 | Late leaf flush | Mature leaves | Sunny |
| 13 June 2019 | Multispectral | 1772 | 85/85 | Mature leaves | Mature leaves | Overcast |
| 27 Sept. 2019 | Multispectral | 1232 | 85/75 | Senescence | Senescence | Overcast |
| 27 Sept. 2019 | RGB | 1497 | 85/85 | Senescence | Senescence | Overcast |
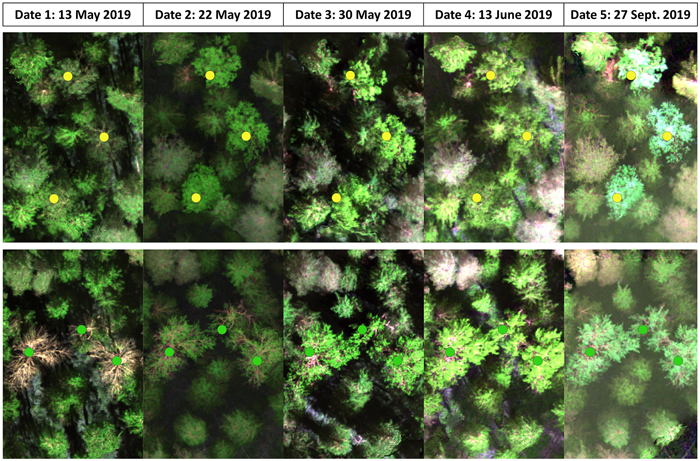
Fig. 2. False-color images from the five inventoried dates based on the collected multispectral data depicting the developmental stages of birches, both silver and downy birch (yellow dots) in the upper row and European aspen (green dots) in the bottom row.
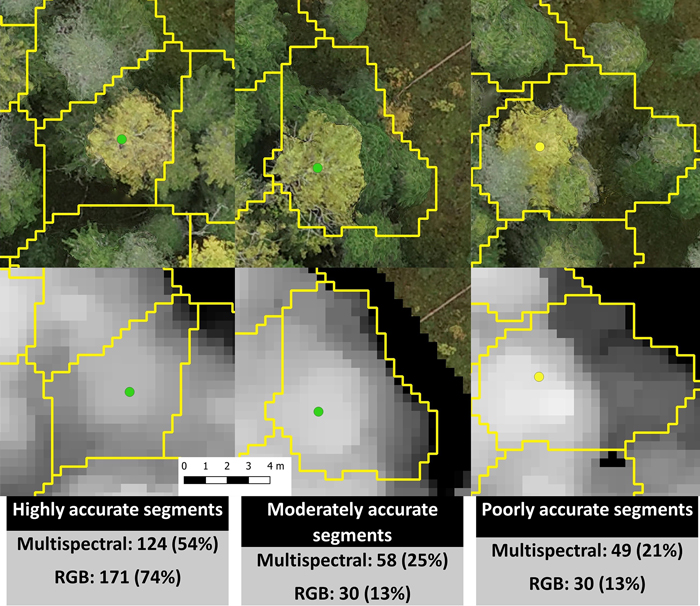
Fig. 3. Examples of highly, moderately, and poorly accurate automatic multispectral- and RGB-based segmentations and the number and percentage of segments in each accuracy category. The green dots represent European aspen, the yellow dot a silver birch, and the segments are outlined in yellow. The segmentation accuracies in this figure are from date 5 (2019-09-27). The pixel size is 3.3 cm.
| Table 3. A list of all predictor variables for aspen detection that were extracted from the multispectral image point cloud data based on the individual tree segments. Abbreviations: H = height; R = red; G = green; B = blue; RE = red edge; NIR = near infrared; NDVI = normalized difference vegetation index; GNDVI = green normalized difference vegetation index. | |
| Predictors | Description |
| Height | |
| Relative H P5, H P10, …, H P95, H P99 | Height percentiles |
| Relative H Mean | Mean |
| Relative H Median | Median |
| H SD | Standard deviation |
| H Skew | Skewness |
| H Kurt | Kurtosis |
| H CV | Coefficient of variation |
| H VAR | Variance |
| Normalized spectral | |
| R;G;B;RE;NIR P5, R;G;B;RE;NIR P25, R;G;B;RE;NIR P75, R;G;B;RE;NIR P95 | Band percentiles |
| R;G;B;RE;NIR Mean | Mean |
| R;G;B;RE;NIR SD | Standard deviation |
| R;G;B;RE;NIR Skew | Skewness |
| R;G;B;RE;NIR Kurt | Kurtosis |
| NDVI;GNDVI P95* | NDVI and GNDVI 95% percentiles |
| NDVI;GNDVI Mean* | NDVI and GNDVI mean |
| * Equations: NDVI = (NIR – R)/(NIR + R) and GNDVI = (NIR – G)/(NIR + G) | |
| Table 4. Accuracy values obtained from tree species classification by linear discriminant analysis and manual segmentation for the five inventoried dates. The best results obtained in the aspen- and kappa-optimized classifications are bolded. | ||||||
| Optimization criterion | Accuracy values | Date 1: 13 May 2019 | Date 2: 22 May 2019 | Date 3: 30 May 2019 | Date 4: 13 June 2019 | Date 5: 27 Sept. 2019 |
| Aspen-optimized | Kappa coefficient | 0.80 | 0.79 | 0.90 | 0.71 | 0.83 |
| Overall accuracy, % | 85 | 84 | 92 | 78 | 88 | |
| Aspen user’s accuracy, % | 97 | 85 | 96 | 84 | 87 | |
| Aspen producer’s accuracy, % | 96 | 95 | 93 | 91 | 84 | |
| Kappa-optimized | Kappa coefficient | 0.93 | 0.91 | 0.93 | 0.88 | 0.86 |
| Overall accuracy, % | 95 | 93 | 94 | 91 | 90 | |
| Aspen user’s accuracy, % | 96 | 90 | 92 | 85 | 86 | |
| Aspen producer’s accuracy, % | 96 | 83 | 94 | 84 | 83 | |
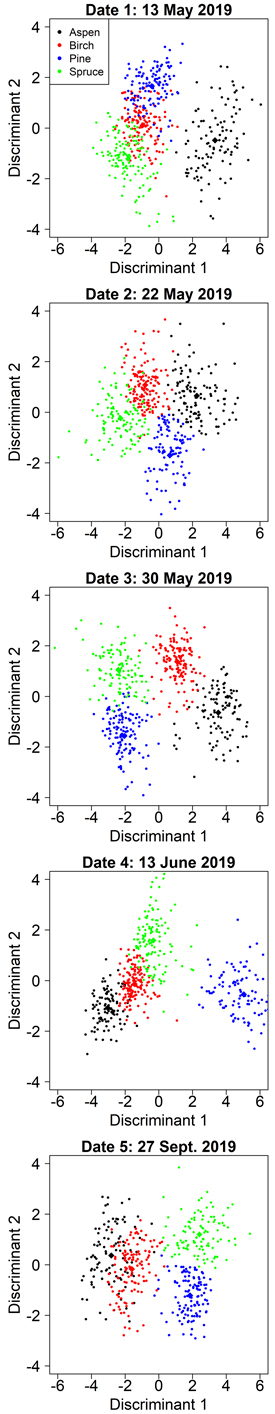
Fig. 4. Class separation by two discriminant axes in the aspen-optimized tree species classification by manual segmentation on the five inventoried dates.
| Table 5. The selected predictors, their normalized and non-normalized (in parentheses) means for all four tree species, and the discriminant function coefficients obtained from the aspen-optimized tree species classification by linear discriminant analysis and manual segmentation. The most important predictors for each discriminant and date are bolded. Abbreviations: P = Percentile; H = height; R = red; G = green; B = blue; RE = red edge; NIR = near infrared; NDVI = normalized difference vegetation index; GNDVI = green normalized difference vegetation index. Birches refers to silver and downy birch. | |||||||
| Dates | Predictors | Predictor means for European aspen | Predictor means for birches | Predictor means for Scots pine | Predictor means for Norway spruce | LD1 | LD2 |
| Date 1: 13 May 2019 | H P45 | 0.48 (0.85) | –0.06 (0.79) | 0.04 (0.80) | –0.37 (0.76) | 0.22 | –0.24 |
| G P95 | 1.34 (0.14) | –0.18 (0.12) | –0.19 (0.12) | –0.75 (0.12) | 0.61 | –1.34 | |
| RE P95 | –0.89 (0.27) | 0.79 (0.29) | –0.04 (0.28) | –0.13 (0.28) | 1.47 | –1.36 | |
| RE P75 | –1.12 (0.25) | 0.70 (0.28) | 0.23 (0.27) | –0.09 (0.26) | –2.28 | 1.86 | |
| NDVI Mean | –1.16 (0.64) | 0.16 (0.73) | –0.37 (0.69) | 1.17 (0.80) | –1.00 | –2.00 | |
| Date 2: 22 May 2019 | H P70 | 0.57 (0.91) | 0.23 (0.89) | 0.01 (0.88) | –0.76 (0.83) | 0.64 | 0.47 |
| NIR SD | 1.03 (0.05) | –0.42 (0.03) | 0.05 (0.04) | –0.43 (0.03) | 0.48 | 0.45 | |
| R Skew | –0.62 (0.19) | 0.84 (1.21) | –0.91 (–0.01) | 0.43 (0.92) | –0.14 | 1.59 | |
| RE Skew | 0.65 (–0.27) | –0.13 (–0.61) | –0.55 (–0.79) | 0.15 (–0.49) | –0.04 | 0.72 | |
| NIR P25 | –1.13 (0.41) | 0.41 (0.46) | –0.51 (0.43) | 0.98 (0.48) | –1.24 | –0.42 | |
| Date 3: 30 May 2019 | H P55 | 0.46 (0.85) | 0.11 (0.82) | 0.02 (0.81) | –0.54 (0.76) | 0.45 | –0.36 |
| B Kurt | –0.22 (2.14) | 0.81 (5.47) | –0.72 (0.50) | –0.07 (2.61) | 0.07 | 0.28 | |
| RE P95 | 1.16 (0.32) | 0.64 (0.31) | –0.91 (0.27) | –0.87 (0.27) | 4.45 | –0.25 | |
| B P75 | 0.35 (0.06) | –0.77 (0.05) | 1.08 (0.07) | –0.44 (0.05) | 0.25 | –1.33 | |
| RE P75 | 0.94 (0.30) | 0.73 (0.29) | –0.78 (0.26) | –0.91 (0.26) | –2.21 | 0.16 | |
| Date 4: 13 June 2019 | H P65 | –0.23 (0.01) | –0.01 (0.01) | –0.35 (0.01) | 0.56 (0.01) | –0.04 | –0.53 |
| R SD | 0.16 (0.02) | –0.34 (0.01) | 0.77 (0.02) | –0.50 (0.01) | –0.50 | 0.26 | |
| B P25 | –0.56 (0.04) | –0.56 (0.04) | 1.50 (0.06) | –0.33 (0.04) | 2.02 | 0.56 | |
| R P25 | –0.66 (0.04) | –0.53 (0.04) | 1.59 (0.08) | –0.37 (0.04) | –9.09 | –4.21 | |
| NDVI Mean | 0.52 (0.84) | 0.55 (0.84) | –1.53 (0.71) | 0.43 (0.83) | –4.49 | –3.70 | |
| Date 5: 27 Sept. 2019 | H P95 | 0.32 (0.97) | 0.33 (0.97) | –0.04 (0.96) | –0.63 (0.95) | –0.40 | –0.17 |
| NIR Skew | 0.72 (1.03) | 0.48 (0.86) | –0.02 (0.51) | –1.17 (–0.30) | –0.30 | –1.26 | |
| G P95 | 0.78 (0.14) | 0.69 (0.14) | –0.46 (0.13) | –1.04 (0.12) | –0.44 | –0.79 | |
| RE P95 | 1.10 (0.32) | 0.66 (0.31) | –0.95 (0.27) | –0.81 (0.27) | –3.51 | 1.49 | |
| RE P75 | 1.03 (0.30) | 0.72 (0.30) | –0.89 (0.26) | –0.87 (0.26) | 1.86 | 0.12 | |
| Table 6. The selected predictors, their normalized and non-normalized (in parentheses) means for all four tree species, and the discriminant function coefficients obtained from the kappa-optimized tree species classification by linear discriminant analysis and manual segmentation. The most important predictors for each discriminant and date are bolded. Abbreviations: P = Percentile; H = height; R = red; G = green; B = blue; RE = red edge; NIR = near infrared; NDVI = normalized difference vegetation index; GNDVI = green normalized difference vegetation index. Birches refers to silver and downy birch. | |||||||
| Dates | Predictors | Predictor means for European aspen | Predictor means for birches | Predictor means for Scots pine | Predictor means for Norway spruce | LD1 | LD2 |
| Date 1: 13 May 2019 | G P95 | 1.34 (0.14) | –0.18 (0.12) | –0.19 (0.12) | –0.75 (0.12) | 0.91 | 1.43 |
| RE P95 | –0.89 (0.27) | 0.79 (0.29) | –0.04 (0.28) | –0.13 (0.28) | 1.44 | 0.10 | |
| G P75 | 1.21 (0.13) | –0.37 (0.11) | 0.15 (0.11) | –0.74 (0.11) | –1.81 | –4.20 | |
| RE P75 | –1.12 (0.25) | 0.70 (0.28) | 0.23 (0.27) | –0.09 (0.26) | –2.40 | 0.74 | |
| NIR P25 | –1.03 (0.43) | 0.04 (0.48) | –0.36 (0.46) | 1.19 (0.53) | –2.68 | –2.91 | |
| Date 2: 22 May 2019 | H P70 | 0.57 (0.91) | 0.23 (0.89) | 0.01 (0.88) | –0.76 (0.83) | –0.75 | –0.29 |
| NIR SD | 1.03 (0.05) | –0.42 (0.03) | 0.05 (0.04) | –0.43 (0.03) | –0.64 | –0.53 | |
| G P95 | 1.17 (0.14) | –0.07 (0.13) | –0.28 (0.13) | –0.64 (0.13) | –0.33 | 0.72 | |
| RE P95 | 0.18 (0.31) | 1.17 (0.33) | –0.80 (0.29) | –0.76 (0.29) | –1.71 | –0.18 | |
| R P25 | 0.76 (0.09) | –0.94 (0.06) | 1.00 (0.09) | –0.51 (0.06) | –0.19 | –2.07 | |
| Date 3: 30 May 2019 | H P55 | 0.46 (0.85) | 0.11 (0.82) | 0.02 (0.81) | –0.54 (0.76) | 0.34 | 0.47 |
| R Mean | 0.01 (0.06) | –0.80 (0.05) | 1.36 (0.08) | –0.40 (0.06) | –0.54 | 2.48 | |
| RE P95 | 1.16 (0.32) | 0.64 (0.31) | –0.91 (0.27) | –0.87 (0.27) | 4.29 | 1.24 | |
| NIR P75 | –0.32 (0.57) | 0.07 (0.58) | –0.48 (0.56) | 0.67 (0.61) | –0.22 | 0.97 | |
| RE P75 | 0.94 (0.30) | 0.73 (0.29) | –0.78 (0.26) | –0.91 (0.26) | –2.30 | –0.07 | |
| Date 4: 13 June 2019 | B Mean | –0.45 (0.04) | –0.58 (0.04) | 1.44 (0.06) | –0.35 (0.04) | –1.58 | –2.96 |
| G Mean | 0.22 (0.11) | –0.65 (0.10) | 0.74 (0.11) | –0.15 (0.10) | 0.30 | 3.26 | |
| RE P75 | 1.02 (0.27) | 0.38 (0.27) | –0.70 (0.26) | –0.63 (0.26) | –0.49 | –2.76 | |
| R P25 | –0.66 (0.04) | –0.53 (0.04) | 1.59 (0.08) | –0.37 (0.04) | 4.29 | –0.18 | |
| GNDVI P95 | –0.24 (0.66) | 0.42 (0.68) | –0.58 (0.65) | 0.28 (0.67) | 0.52 | 0.42 | |
| Date 5: 27 Sept. 2019 | H P70 | 0.45 (0.92) | 0.36 (0.91) | –0.04 (0.89) | –0.78 (0.85) | –0.60 | –0.07 |
| NIR SD | 0.64 (0.05) | 0.42 (0.05) | –0.30 (0.04) | –0.76 (0.03) | –0.52 | –0.12 | |
| RE P95 | 1.10 (0.32) | 0.66 (0.31) | –0.96 (0.27) | –0.81 (0.27) | –2.42 | 2.08 | |
| RE P75 | 1.03 (0.30) | 0.72 (0.30) | –0.89 (0.26) | –0.87 (0.26) | 0.33 | –2.92 | |
| B P25 | –0.39 (0.04) | –0.54 (0.03) | 1.49 (0.05) | –0.46 (0.03) | –0.21 | –2.10 | |
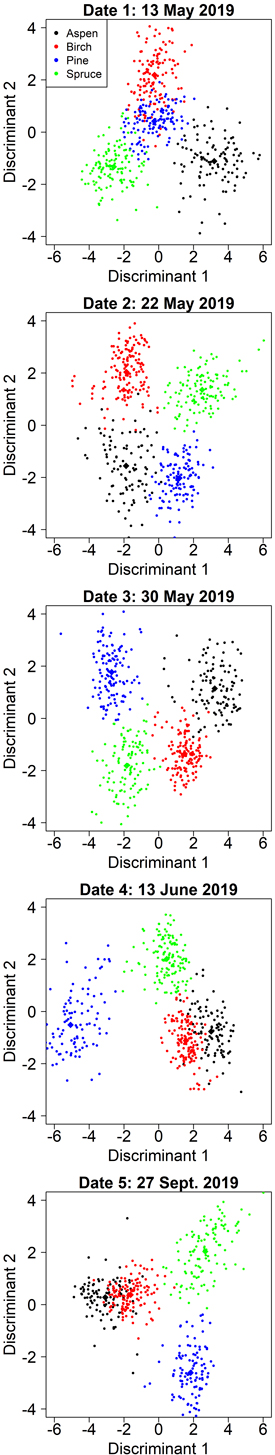
Fig. 5. Class separation by two discriminant axes in the kappa-optimized tree species classification by manual segmentation on the five inventoried dates.
| Table 7. Tree species classification accuracy values obtained from both the aspen-optimized and the kappa-optimized variable selections based on multispectral-based and RGB-based segmentations. The best results in the aspen- and kappa-optimized classifications are bolded. | ||||||
| Optimization criterion | Accuracy values | Date 1: 13 May 2019 | Date 2: 22 May 2019 | Date 3: 30 May 2019 | Date 4: 13 June 2019 | Date 5: 27 Sept. 2019 |
| Multispectral-based segmentation | ||||||
| Aspen-optimized | Kappa coefficient | 0.55 | 0.52 | 0.80 | 0.65 | 0.72 |
| Overall accuracy, % | 66 | 64 | 85 | 74 | 79 | |
| Aspen user’s accuracy, % | 89 | 85 | 86 | 87 | 77 | |
| Aspen producer’s accuracy, % | 91 | 78 | 84 | 83 | 81 | |
| Kappa-optimized | Kappa coefficient | 0.77 | 0.78 | 0.81 | 0.79 | 0.75 |
| Overall accuracy, % | 83 | 84 | 86 | 84 | 81 | |
| Aspen user’s accuracy, % | 88 | 79 | 84 | 78 | 75 | |
| Aspen producer’s accuracy, % | 84 | 71 | 76 | 83 | 79 | |
| RGB-based segmentation | ||||||
| Aspen-optimized | Kappa coefficient | 0.70 | 0.80 | 0.89 | 0.71 | 0.83 |
| Overall accuracy, % | 78 | 85 | 91 | 79 | 87 | |
| Aspen user’s accuracy, % | 97 | 89 | 91 | 85 | 85 | |
| Aspen producer’s accuracy, % | 93 | 87 | 88 | 81 | 79 | |
| Kappa-optimized | Kappa coefficient | 0.84 | 0.90 | 0.88 | 0.84 | 0.85 |
| Overall accuracy, % | 88 | 92 | 91 | 88 | 89 | |
| Aspen user’s accuracy, % | 90 | 90 | 88 | 80 | 82 | |
| Aspen producer’s accuracy, % | 92 | 79 | 83 | 82 | 80 | |