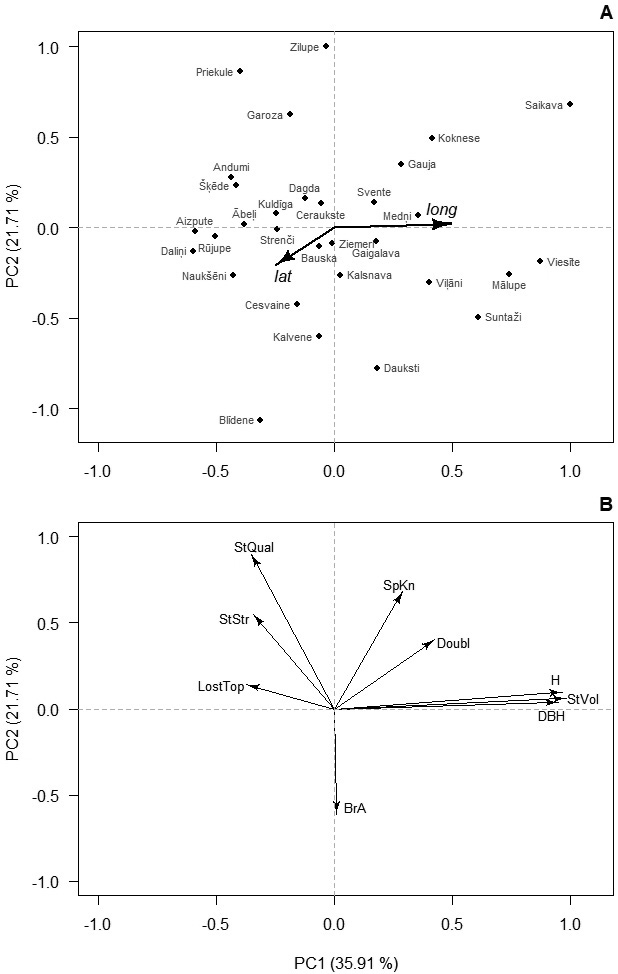
Fig. 1. Ordination of the studied provenances (A) and studied traits (B) of 14-years-old silver birch in Latvia according to the first two principal components (PC) of their variation. In A, axes are rescaled for clarity; and arrows indicate correlation with latitude (lat) and longitude (lon) of origin of the provenances. Numbers in brackets indicate the amount of explained variation. Abbreviations: H – height, DBH – diameter at breast height, StVol – stem volume, Doubl –probability of double leaders, SpKn – spike knots, StQual – overall stem quality, StStr – stem straightness, LostTop – lost top, BrA – branch angle.
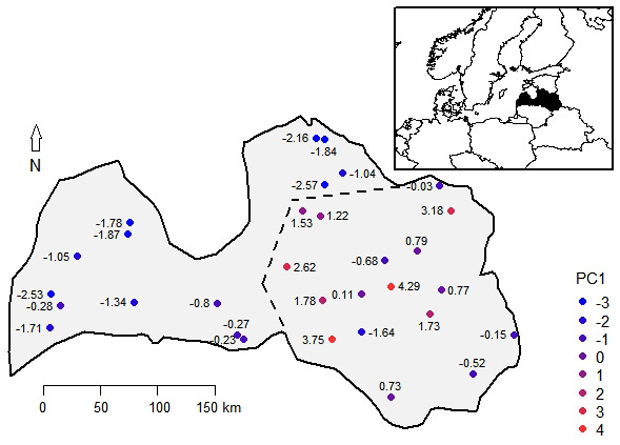
Fig. 2. The scores of the first principal component (PC1) of studied phenotypic traits of 14-years-old silver birch progenies overlain on their geographic locations in Latvia. The dotted line indicates border of two arbitrarily distinguished silver birch provenance regions – the coastal (western) and the inland (eastern) region.
| Table 1. Regional means, minimum and maximum provenance means, narrow sense individual tree heritability and additive genetic coefficient of variation of the studied traits in the phenotypically distinguished provenance regions of silver birch in Latvia. Letters in uppercase denote significant differences (p ≤ 0.05) between provenance regions for each trait. | ||||||||
| Trait | Regional mean ± standard deviation | Minimum provenance mean | Maximum provenance mean | Individual tree heritability h2 ± standard error (additive genetic coefficient of variation CVa, %) | ||||
| Coastal | Inland | Coastal | Inland | Coastal | Inland | Coastal | Inland | |
| Height (m) | 11.8 A ± 1.90 | 12.3 B ± 1.89 | 11.2 | 11.7 | 12.0 | 12.5 | 0.28 ± 0.037 (7.16) | 0.61 ± 0.061 (10.11) |
| Diameter at breast height (cm) | 9.06 A ± 2.81 | 9.8 B ± 2.84 | 8.5 | 8.7 | 10.0 | 10.7 | 0.32 ± 0.037 (16.56) | 0.42 ± 0.048 (17.53) |
| Stem volume (dm3) | 45.2 A ± 26.56 | 53.2 B ± 29.87 | 39.3 | 43.2 | 49.2 | 62.1 | 0.29 ± 0.035 (29.35) | 0.41 ± 0.048 (33.41) |
| Spike knots (% of trees) | 57.3 A | 59.1 B | 42.1 | 53.6 | 60.8 | 65.4 | 0.05 ± 0.017 | 0.07 ± 0.020 |
| Double leaders (% of trees) | 9.7 A | 11.4 B | 2.8 | 5.00 | 10.4 | 13.9 | 0.15 ± 0.041 | 0.16 ± 0.014 |
| Lost top (% of trees) | 52.3 A | 49.2 B | 50.7 | 46.2 | 65.6 | 62.4 | 0.03 ± 0.017 | 0.01 ± 0.017 |
| Stem straightness score | 2.2 A | 2.2 A | 2.1 | 2.1 | 2.2 | 2.2 | 0.45 ± 0.060 | 0.26 ± 0.060 |
| Overall stem quality score | 2.8 A | 2.8 A | 2.7 | 2.7 | 2.8 | 2.9 | 0.24 ± 0.040 | 0.28 ± 0.061 |
| Branch angle score | 2.0 A | 2.0 A | 2.0 | 2.0 | 2.0 | 2.0 | 0.51 ± 0.110 | 0.30 ± 0.118 |