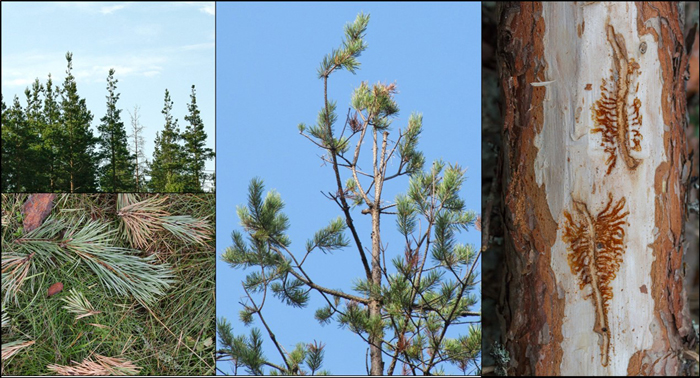
Fig. 1. Top-left and centre: damage by pine shoot beetle results in pine trees deprived of their shoots. Bottom-left: shoots fallen to the ground. Right: two vertical monogamous galleries created by pine shoot beetle females, with larval galleries breaking into adjacent directions. Images by Antti Pouttu and Markus Melin, Natural Resources Institute Finland (CC-BY SA 4.0).
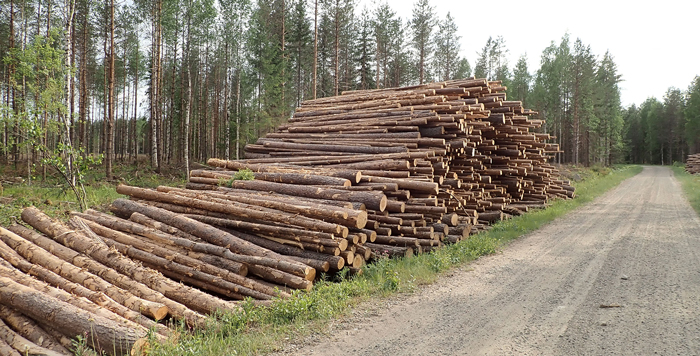
Fig. 2. A common sight in Finland: pile of roundwood (here, Scots pine) harvested during the previous winter is waiting to be transported to the factory. Image by Markus Melin, Natural Resources Institute Finland (CC-BY SA 4.0).
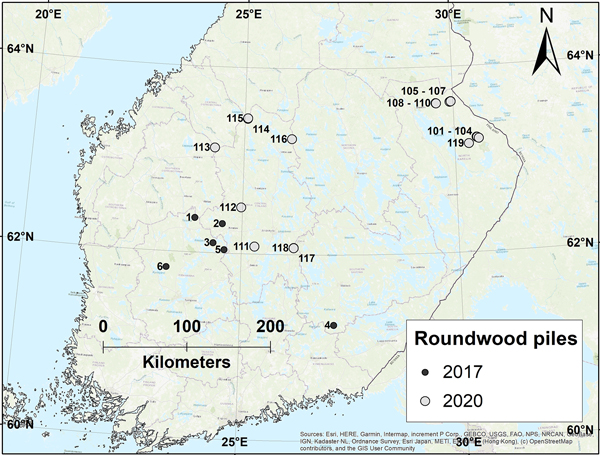
Fig. 3. Location of the roundwood piles used in the study on pine shoot beetle damage in the surrounding forests, separated by the year of field measurements.
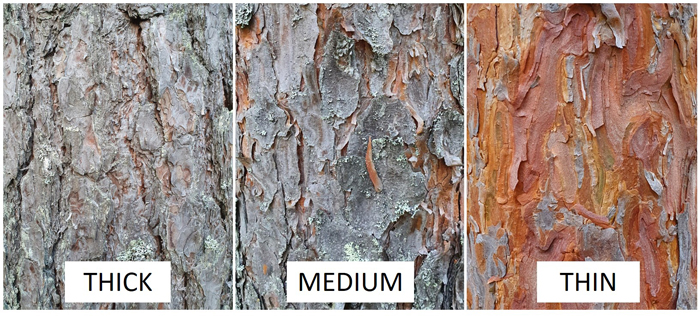
Fig. 4. The three categories of bark thickness used in the 2020 field survey when counting the number of beetle exit holes from the logs; the bark of Scots pine is changing from thick to thin when moving from the base of a log (left) into its top (right).
| Table 1. Auxiliary information on the roundwood piles used in the study on pine shoot beetle damage in forests surrounding the piles. The coordinates are in the WGS84 system (EPSG: 4326). | ||||||
| Pile | Latitude | Longitude | Year | Volume (m3) | No. of measured field plots (shoot damage) | No. of measured samples (emerged insects) |
| 1 | 23.9025844 | 62.3706153 | 2017 | 356 | 9 | 20 |
| 2 | 24.5415178 | 62.3168368 | 2017 | 331 | 7 | 30 |
| 3 | 24.3453392 | 62.108855 | 2017 | 34 | 7 | 20 |
| 4 | 27.1107396 | 61.2459632 | 2017 | 42 | 5 | 16 |
| 5 | 24.6045835 | 62.0375501 | 2017 | 42 | 8 | 16 |
| 6 | 23.3038068 | 61.8281155 | 2017 | 130 | 6 | 31 |
| 101 | 30.5765414 | 63.2180891 | 2020 | 145 | 13 | 29 |
| 102 | 30.5371486 | 63.2287643 | 2020 | 127 | 8 | 29 |
| 103 | 30.5314965 | 63.22911 | 2020 | 59 | 10 | 17 |
| 104 | 30.5243809 | 63.2310969 | 2020 | 149 | 9 | 32 |
| 105 | 29.9444647 | 63.6232792 | 2020 | 40 | 9 | 13 |
| 106 | 29.9426211 | 63.6244717 | 2020 | 39 | 8 | 10 |
| 107 | 29.9159022 | 63.6183939 | 2020 | 144 | 8 | 33 |
| 108 | 29.5883251 | 63.60701 | 2020 | 125 | 8 | 0 |
| 109 | 29.5854189 | 63.6088174 | 2020 | 64 | 9 | 0 |
| 110 | 29.5818343 | 63.6096894 | 2020 | 124 | 8 | 34 |
| 111 | 25.2972062 | 62.0822797 | 2020 | 173 | 12 | 36 |
| 112 | 24.9662172 | 62.4973184 | 2020 | 110 | 13 | 28 |
| 113 | 24.3008883 | 63.1313398 | 2020 | 131 | 9 | 34 |
| 114 | 25.0644776 | 63.4503408 | 2020 | 297 | 8 | 0 |
| 115 | 25.0680649 | 63.4565652 | 2020 | 138 | 8 | 27 |
| 116 | 26.1272094 | 63.2416311 | 2020 | 242 | 9 | 0 |
| 117 | 26.1974721 | 62.0754757 | 2020 | 55 | 9 | 21 |
| 118 | 26.1973003 | 62.0728962 | 2020 | 175 | 9 | 42 |
| 119 | 30.3350948 | 63.1643917 | 2020 | 151 | 13 | 34 |
| Table 2. Candidate variables in the LME models on pine shoot beetle damage in forests close to roundwood piles and on the number of emerged insects from the roundwood piles. * indicates a variable that was retained in the final model. | ||
| Model | Variable | Description |
| Model 1: Emerged insects | Emerged insects (the response) | Number of pine shoot beetle emergence holes in the sampling area, holes per m2. |
| Log diameter* | Diameter of the log (in centimetres), measured from the middle of the sampling window. | |
| Bark thickness* | Thickness of the bark, three categories: thin, medium, thick. | |
| Bark damage* | Proportion of harvester-damaged bark, estimated from the sampling areas at 10% intervals on a 0–100% scale. In the modelling, the variables were tested also as a factorial variable with five levels (0–20% bark damage, 20–40% bark damage etc.) | |
| Basal area, pine | Basal area of the pine in the surrounding forests, measured from the field plots, m2 ha–1. | |
| Site type | Site type of the surrounding forest according to Cajander (1949), estimated from the field plots. | |
| Damaged pine | Occurrence of pine shoot beetle breeding material in the surroundings (binary): snow or wind damage, logging residues, etc. | |
| Model 2: Fallen shoots | Shoot damage (the response) | Number of fallen shoots in a field plot, shoots per m2. |
| Distance* | Distance (in meters) between the plot to the roundwood pile. | |
| Volume* | Volume of the neighbouring roundwood pile. | |
| Basal area, pine | As described above. | |
| Site type | As described above. | |
| Damaged pine | As described above. | |
| Table 3. The LME model on the number of emerged beetles from the forest-stored roundwood piles. | |||
| FIXED EFFECTS | |||
| Parameter | Value | Std. error | p-value |
| Intercept | –103.94 | 73.48 | 0.158 |
| Bark, medium | –1.80 | 28.15 | 0.949 |
| Bark, thick | –117.83 | 32.77 | <0.001 |
| Bark damage, 20–40% | –64.74 | 37.50 | 0.0851 |
| Bark damage, 40–60% | –98.41 | 36.66 | 0.0076 |
| Bark damage, 60–80% | –159.06 | 58.26 | 0.0066 |
| Bark damage, 80–100% | –205.41 | 69.17 | 0.0032 |
| Log diameter | 23.92 | 3.41 | <0.001 |
| RANDOM EFFECTS | |||
| Std. dev. | Residual | ||
| Year | 29.4 | ||
| Roundwood pile | 80.79 | 223.25 | |
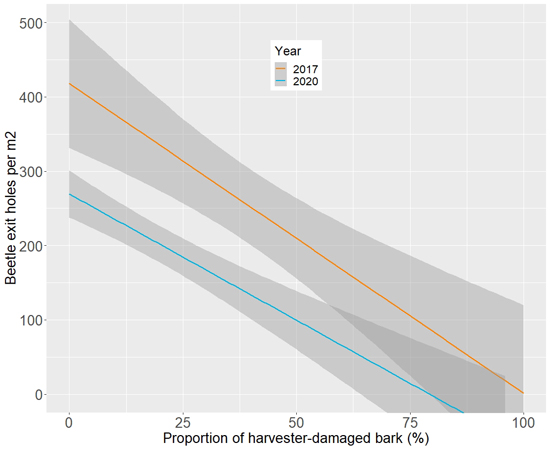
Fig. 5. Visualisation of the relationship between the variable BarkDamage (percentage of bark damaged by the harvester) and the number of beetle exit holes counted from the logs of the forest-stored roundwood piles. The shading illustrates the 95% confidence interval and the different colours indicate different survey years.
| Table 4. Summary statistics on the number of Tomicus piniperda exit holes from each roundwood pile. | |||
| Pile | No. of emergence holes/m2 | ||
| Average | Maximum | Std. dev. | |
| 1 | 162 | 1000 | 274 |
| 2 | 238 | 1063 | 273 |
| 3 | 592 | 1300 | 412 |
| 4 | 90 | 367 | 100 |
| 5 | 392 | 900 | 233 |
| 6 | 121 | 740 | 216 |
| 101 | 152 | 633 | 181 |
| 102 | 80 | 533 | 145 |
| 103 | 137 | 700 | 222 |
| 104 | 178 | 933 | 254 |
| 105 | 326 | 900 | 316 |
| 106 | 337 | 1100 | 297 |
| 107 | 226 | 900 | 270 |
| 110 | 303 | 1267 | 371 |
| 111 | 230 | 800 | 221 |
| 112 | 104 | 1333 | 254 |
| 113 | 192 | 900 | 255 |
| 115 | 264 | 900 | 287 |
| 117 | 138 | 633 | 183 |
| 118 | 233 | 1233 | 323 |
| 119 | 189 | 733 | 217 |
| By bark thickness* | Average | Maximum | Std. dev. |
| Thin bark | 69 | 667 | 156 |
| Medium bark | 220 | 1233 | 287 |
| Thick bark | 296 | 1333 | 275 |
| * Only for piles 101–119, year 2020 measurements | |||
| Table 5. The LME model on the number of fallen shoots per plot (the damage) in a study on pine shoot beetle damage in forests close to roundwood piles. | |||
| FIXED EFFECTS | |||
| Parameter | Value | Std. error | p-value |
| Intercept | 12.76 | 10.75 | 0.24 |
| Distance to pile | –0.69 | 0.11 | <0.001 |
| Volume of pile | 0.21 | 0.06 | 0.003 |
| Residues | 15.60 | 6.10 | 0.01 |
| RANDOM EFFECTS | |||
| Std. dev. | Residual | ||
| Year | 4.63 | ||
| Roundwood pile | 14.84 | 23.3 | |
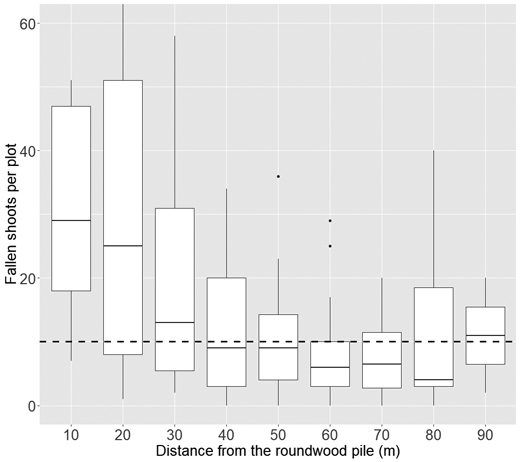
Fig. 6. Number of fallen shoots per plot at different distances from the roundwood piles. At each boxplot, the black horizontal line indicates the median and the white vertical bar the 25th and 75th quantiles. The dashed horizontal line represents the baseline level of fallen shoots that can be considered “normal” in boreal forests.
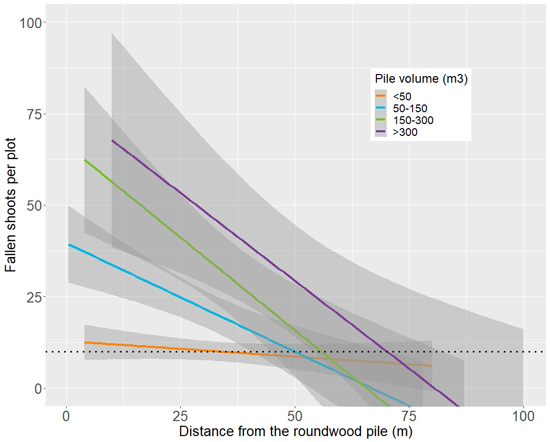
Fig. 7. Linear relationship between the distance from roundwood piles of varying volumes and the number of fallen shoots in a plot. For this illustration, the originally continuous variable Volume was classified in the depicted classes. The grey shading illustrates the 95% confidence intervals.
| Table 6. Tree-level damage (fallen shoots) caused by pine shoot beetles in relation to the distance from the pile. | ||||
| Distance from the pile (m) | Fallen shoots per tree | |||
| Min | Max | Mean | Std. dev. | |
| <10 | 9 | 197 | 47 | 50 |
| 10–20 | 1 | 517 | 63 | 100 |
| 20–30 | 2 | 247 | 40 | 45 |
| 30–40 | 0 | 171 | 23 | 25 |
| 40–50 | 0 | 92 | 23 | 25 |
| 50–60 | 0 | 74 | 19 | 22 |
| 60–70 | 0 | 46 | 18 | 20 |
| >70 | 0 | 100 | 41 | 50 |