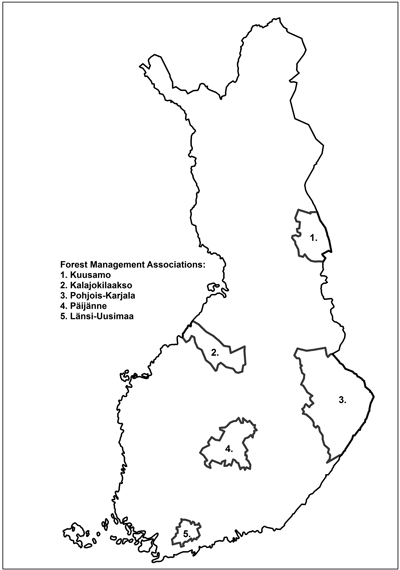
Fig. 1. The location of the five Forest Management Associations included in the study.
| Table 1. Select descriptive statistics for the cases included in the models. | ||||
| Sawlogs | Pulpwood | |||
| Mean | Standard deviation | Mean | Standard deviation | |
| Price (€ m–3) | 51.82 | 8.12 | 16.22 | 3.90 |
| Total volume (m3) | 763.89 | 781.69 | 790.05 | 740.40 |
| Assortment percentage | 20.40 | 21.72 | 11.14 | 13.60 |
| Sawlog percentage | 57.27 | 19.35 | 39.42 | 22.42 |
| Forest haulage distance (m) | 182.44 | 142.54 | 225.36 | 162.59 |
| Table 2. Regression model on stumpage prices (€ m–3) for sawlogs from regeneration felling and for pulpwood in 2008–2012. | ||||
| Sawlogs | Pulpwood | |||
| Number of cases | 4316 | 17808 | ||
| R2 | 0.741 | 0.556 | ||
| Variable | β | S.E. | β | S.E. |
| Constant | 44.647 | 0.587*** | 12.859 | 0.190*** |
| Summer harvestability | 1.223 | 0.165*** | 0.575 | 0.045*** |
| No seasonal harvest restrictions | 1.906 | 0.257*** | 0.679 | 0.091*** |
| Forest damage present | –1.067 | 0.436* | –0.302 | 0.097** |
| ln total volume | 1.484 | 0.076*** | 0.736 | 0.024*** |
| Forest haulage distance (km) | –0.296 | 0.497 | –1.559 | 0.133*** |
| Assortment percentage | 0.034 | 0.004*** | 0.024 | 0.002*** |
| Birch*assortment percentage | 0.154 | 0.015*** | - | - |
| Sawlog percentage | 0.020 | 0.004*** | 0.016 | 0.001*** |
| Q1_2008 | 5.255 | 0.493*** | 1.493 | 0.170*** |
| Q2_2008 | 4.510 | 0.511*** | 1.952 | 0.154*** |
| Q3_2008 | 3.861 | 0.385*** | 2.045 | 0.121*** |
| Q4_2008 | 2.184 | 0.389*** | 2.114 | 0.119*** |
| Q1_2009 | –3.886 | 0.672*** | 0.716 | 0.210*** |
| Q2_2009 | –8.014 | 0.645*** | –0.175 | 0.221 |
| Q3_2009 | –8.342 | 0.453*** | –1.088 | 0.165*** |
| Q4_2009 | –7.089 | 0.383*** | –0.999 | 0.119*** |
| Q1_2010 | –5.190 | 0.446*** | –0.134 | 0.132 |
| Q2_2010 | –1.573 | 0.432*** | 0.164 | 0.132 |
| Q3_2010 | 0.990 | 0.378** | 0.828 | 0.117*** |
| Q4_2010 | 0.766 | 0.354* | 0.491 | 0.111*** |
| Q1_2011 | 0.457 | 0.416 | 0.524 | 0.123*** |
| Q2_2011 | 1.303 | 0.414** | 0.767 | 0.129*** |
| Q3_2011 | 2.322 | 0.433*** | 0.814 | 0.142*** |
| Q4_2011 | 0.867 | 0.397* | 0.610 | 0.129*** |
| Q1_2012 | 0.205 | 0.413 | 0.306 | 0.123** |
| Q2_2012 | 0.498 | 0.498 | 0.062 | 0.149 |
| Q3_2012 | 0.973 | 0.453* | 0.184 | 0.142 |
| Pohjois-Karjala | –0.842 | 0.189*** | –1.793 | 0.056*** |
| Länsi-Uusimaa | –2.498 | 0.223*** | –1.379 | 0.078*** |
| Päijänne | –0.192 | 0.197 | –0.829 | 0.064*** |
| Kuusamo | –7.775 | 0.574*** | –4.924 | 0.080*** |
| Spruce sawlog | –1.021 | 0.156*** | - | - |
| Birch sawlog | –13.529 | 0.190*** | - | - |
| First thinning | - | - | –4.350 | 0.060*** |
| Thinning | - | - | –3.019 | 0.047*** |
| Spruce pulpwood | - | - | 2.040 | 0.048*** |
| Birch pulpwood | - | - | –0.966 | 0.048*** |
| * Corresponding p-value less than 0.05, ** less than 0.01 and *** less than 0.001. | ||||
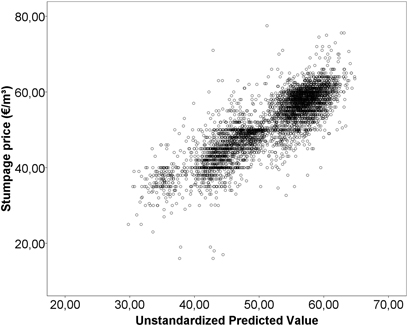
Fig. 2. Predicted values plotted against stumpage prices for sawlogs.
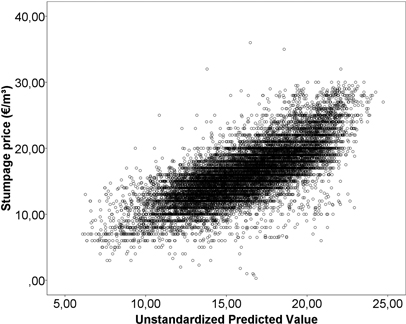
Fig. 3. Predicted values plotted against stumpage prices for pulpwood.
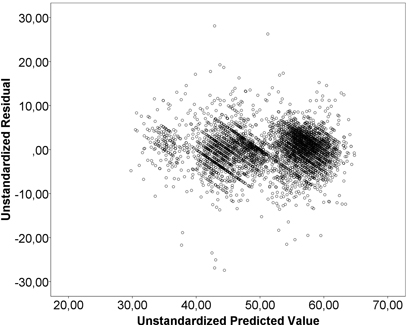
Fig. 4. Residuals and predicted values from the sawlog model.
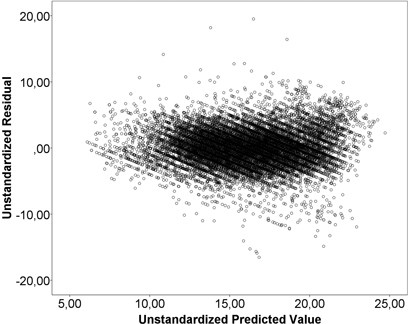
Fig. 5. Residuals and predicted values from the pulpwood model.
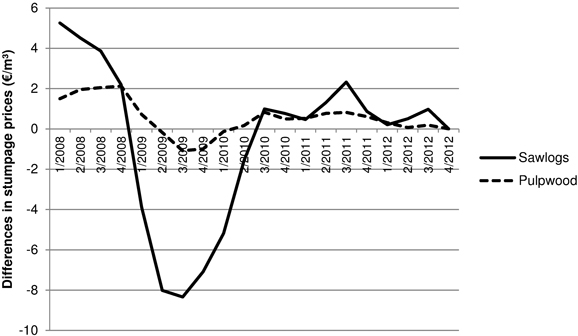
Fig. 6. Quarterly changes in stumpage prices for sawlogs and pulpwood as expressed in €/m3, 4/2012 = 0.
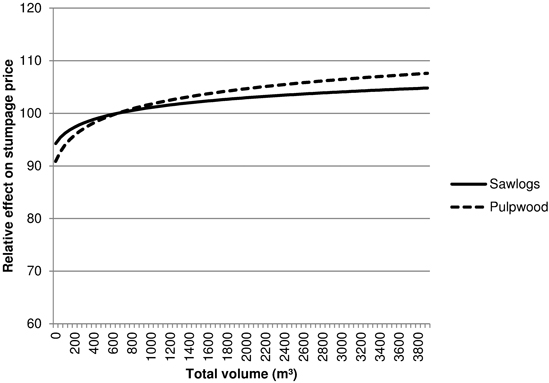
Fig. 7. The relative effect of the total volume of the sale on stumpage prices (€/m3), 750 m3 = 100.
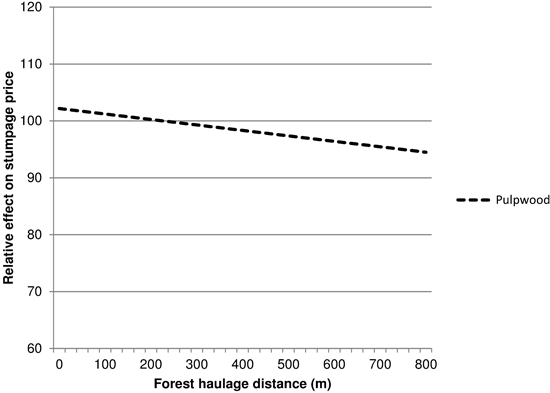
Fig. 8. The relative effect of forest haulage distance on stumpage prices (€/m3) of pulpwood, 225 m = 100.