| Table 1. The mean and range of the validated stand characteristics for young (H < 9 m) and advanced (H ≥ 9 m) stands from validation data. | ||||||||
| G | N | DDOM | HDOM | Volume | Logs | Pulp | Waste | |
| Young stands | n = 248 | |||||||
| mean | 8.9 | 1590 | 14.7 | 8.7 | 40.1 | - | 32.4 | 7.6 |
| min | 0.4 | 251 | 4.4 | 2.8 | 0.9 | - | 0.0 | 0.9 |
| max | 24.1 | 4552 | 30.7 | 17.1 | 117.3 | - | 101.0 | 29.1 |
| Advanced stands | n = 219 | |||||||
| mean | 17.4 | 872 | 25.3 | 17.0 | 134.4 | 78.7 | 51.7 | 4.0 |
| min | 2.4 | 122 | 15.2 | 11.0 | 14.8 | 0.0 | 6.3 | 0.4 |
| max | 34.4 | 2988 | 36.4 | 26.8 | 341.6 | 249.8 | 128.0 | 18.3 |
| Table 2. The recovery equations and their use in Methods A–D. | |
| Recovery equation | Used in Method(s) |
| A | |
 | B |
| C | |
 | D |
| A, B, C, D | |
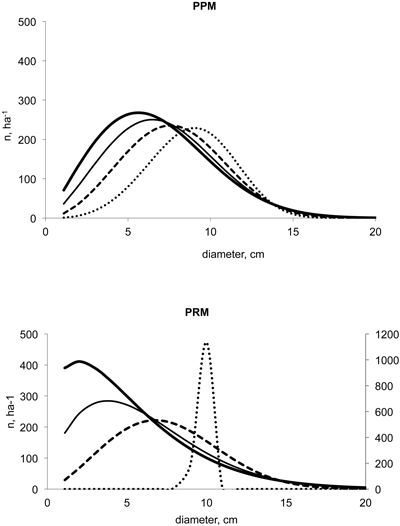
Fig. 1. Two-parameter Weibull distributions predicted with BLUP estimation for PPM (Siipilehto 2011a) and Method D for PRM with respect to variation in N of 3100 (▬), 2500 (─), 1900 (- - -) and 1300 ha–1 (∙∙∙) when DGM was 10 cm and G 10 m2ha–1.
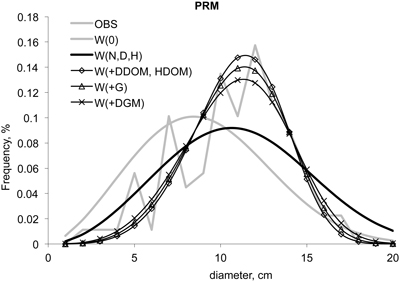
Fig. 2. Parameter recovery method for the 2-parameter Weibull function localised to a real stand. BLUP estimation (Siipilehto 2011a) was used for calibrating the prediction of basal area, if it was unknown.
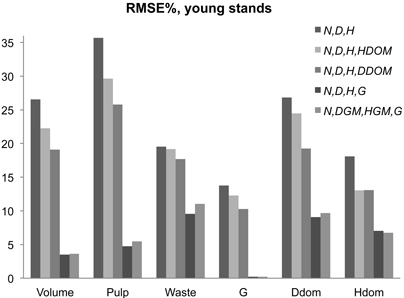
Fig. 3. RMSE% in young stand characteristics using parameter recovery with the BLUP estimation for missing stand variables (Siipilehto 2011a). Method A was used except when G, DGM, HGM and N were known, in which case, Method D was applied.
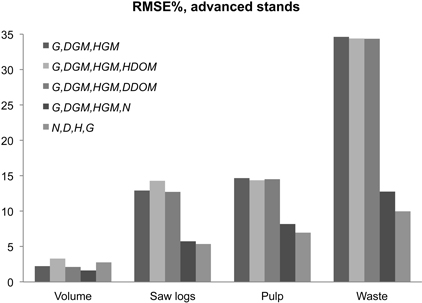
Fig. 4. RMSE% in volume characteristics using parameter recovery with BLUP estimation for missing stand variable in advanced stands (Siipilehto 2011a). Method D was used except when G, D, H and N were known, in which case, Method A was applied.
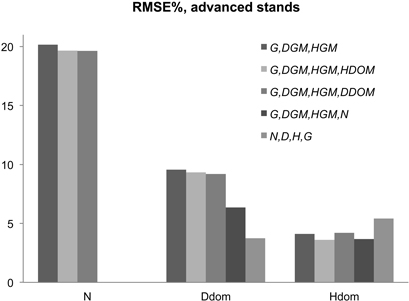
Fig. 5. RMSE% in stem number and dominant tree characteristics using parameter recovery with BLUP estimation for missing stand variables in advanced stands (Siipilehto 2011a).
| Table 3. The bias (%) in stand characteristics using the Weibull dbh-frequency distribution for young stands (H < 9 m) with varying combination of known stand characteristics used as calibrating variables. The models included the BLUP estimation for the Weibull by Siipilehto (2011a) and PRM for the Weibull along with the BLUP estimates for the unknown stand characteristics by Siipilehto 2011a. The best validating criteria with respect to the combination of input variables are highlighted in bold. | |||||||
| Model | Predictors | Volume | Pulp | Waste | G | DDOM | HDOM |
| BLUP | N, D, H | 4.6 | 5.7 | 0.3 | 1.4 | 3.5 | 3.6 |
| N, D, H, HDOM | 1.2 | 1.6 | –0.3 | –0.2 | 1.3 | 1.7 | |
| N, D, H,DDOM | 1.7 | 2.3 | –0.8 | –0.1 | 1.3 | 2.6 | |
| N, D, H, G | 2.4 | 2.8 | 0.7 | 0.2 | 1.9 | 2.8 | |
| N, DGM, HGM, G | 1.6 | 2.3 | –1.2 | 0.1 | 1.4 | 2.2 | |
| PRM | N, D, H | 12.3 | 16.0 | –0.9 | 6.6 | 12.4 | 8.5 |
| N, D, H, HDOM | 9.5 | 12.2 | –0.8 | 5.3 | 8.8 | 5.3 | |
| N, D, H,DDOM | 8.1 | 10.5 | –1.1 | 4.4 | 7.3 | 6.1 | |
| N, D, H, G | 0.6 | 0.4 | 1.3 | 0.0 | –2.7 | 1.0 | |
| N, DGM, HGM, G | 0.5 | 0.4 | 1.0 | 0.0 | –2.2 | 1.6 | |
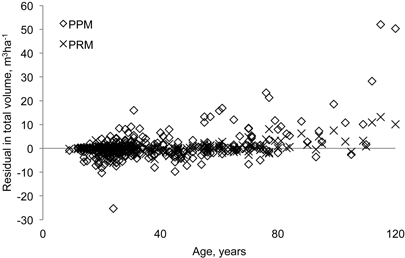
Fig. 6. Residual errors in total volume using BLUP estimation (Siipilehto 2011a) as a parameter prediction model (PPM) or parameter recovery method (PRM) for predicting the Weibull distribution with D, H, N and G as the known stand variables in young stands.
| Table 4. The bias (%) in stand characteristics using the Weibull as a dbh-frequency (WN) or basal area-dbh distribution (WG) for advanced stands (H ≥ 9 m) with varying combinations of known stand characteristics used as calibrating variables. The models included the BLUP estimation for the Weibull distribution (Siipilehto 2011a) and PRM for the Weibull function along with the BLUP estimates for the unknown stand characteristics by Siipilehto 2011a. The best validating criteria with respect to the combination of input variables are highlighted in bold. | ||||||||
| Model | Predictors | Volume | Logs | Pulp | Waste | N | DDOM | HDOM |
| WN BLUP | G, DGM, HGM | 1.2 | 10.0 | –9.9 | 1.8 | –1.5 | 1.6 | 0.4 |
| G, DGM, HGM, HDOM | 1.1 | 10.0 | –10.1 | 2.5 | –1.2 | 1.8 | 0.5 | |
| G, DGM, HGM, DDOM | 1.0 | 9.6 | –9.8 | 2.9 | –0.9 | 1.7 | 0.4 | |
| G, DGM, HGM, N | 0.9 | 7.3 | –7.4 | –0.6 | –1.9 | 0.8 | 0.2 | |
| G, D, H, N | –0.9 | 0.2 | –2.7 | 2.0 | 1.7 | –2.8 | –2.3 | |
| WG BLUP | G, DGM, HGM | 0.2 | 1.6 | –2.2 | 5.0 | 2.4 | 0.1 | –0.2 |
| G, DGM, HGM, HDOM | 0.2 | 1.8 | –2.6 | 5.5 | 2.4 | 0.3 | –0.0 | |
| G, DGM, HGM, DDOM | 0.2 | 2.0 | –2.6 | 2.5 | 0.5 | 0.2 | –0.2 | |
| G, DGM, HGM, N | 0.2 | 1.6 | –2.2 | 3.4 | 1.6 | –0.2 | –0.2 | |
| G, D, H, N | –2.3 | –8.7 | 7.8 | 17.2 | 12.4 | –4.7 | –3.0 | |
| WN PRM | G, DGM, HGM | 1.1 | 5.1 | –2.3 | –23.4 | –13.8 | –7.4 | –2.1 |
| G, DGM, HGM, HDOM | 1.8 | 6.4 | –2.2 | –23.3 | –13.0 | –7.2 | –0.3 | |
| G, DGM, HGM, DDOM | 0.7 | 5.1 | –2.9 | –23.9 | –13.5 | –7.3 | –2.1 | |
| G, DGM, HGM, N | –0.1 | 0.8 | –1.6 | 2.8 | 0.0 | –0.3 | –0.5 | |
| G, D, H, N | –0.9 | 0.0 | –2.5 | 1.2 | 0.0 | –1.0 | –1.8 | |