| Table 1. Main continuous and categorical characteristics of the sample plots (the PSP3000 data) used in modelling the bilberry and lingonberry cover in Finland (N = 2199). Sites I–VIII refer to different site quality classes (I = herb-rich sites on brown soils, eutrophic mires, II = herb-rich sites, mesotrophic mires, III = mesic sites, meso-oligotrophic mires, IV = sub-xeric sites, oligotrophic mires, V = xeric sites, poor ombro-oligotrophic bogs, VI = barren sites, ombrotrophic bogs, VII = rocky and sandy soils and alluvial land, VIII = poorly productive and unproductive land). | |||
| Variable | Mean | SD | Range |
| Bilberry cover (%) | 9.2 | 13.5 | 0.0–87.5 |
| Lingonberry cover (%) | 6.7 | 7.6 | 0.0–57.5 |
| Stand age (years) | 61 | 48 | 0–325 |
| Stand basal area (m2 ha–1) | 13.2 | 10.1 | 0.0–53.8 |
| Altitude (m) | 137 | 8 | 0–830 |
| Temperature sum (dd) | 1085 | 170 | 410–1360 |
| Variable | Mineral soils (N = 1812) | Spruce mires (N = 120) | Pine mires (N = 267) |
| Site I | 40 | 2 | 3 |
| Site II | 270 | 39 | 5 |
| Site III | 802 | 57 | 31 |
| Site IV | 534 | 13 | 97 |
| Site V | 78 | n.a. | 130 |
| Site VI | 0 | n.a. | 1 |
| Site VII | 35 | n.a. | n.a. |
| Site VIII, poorly productive land | 28 | n.a. | n.a. |
| Site VIII, waste land | 25 | n.a. | n.a. |
| n.a. = not applicable | |||
| Table 2. Parameter estimates and goodness-of-fit statistics of the multi-level quasi-Poisson models estimated for the percentage cover of bilberry in the Finnish PSP3000 data (N = 2199). Sites I–VIII refer to different site quality classes (see Table 1). | ||
| Variable | Estimate | Std. error |
| Intercept | 0.7185*** | 0.0869 |
| Site I, mineral soils | –1.8948*** | 0.3290 |
| Site II, mineral soils | –0.9147*** | 0.0863 |
| Site III, mineral soils | 0.0 a | -- |
| Site IV, mineral soils | –0.5696*** | 0.0614 |
| Site V, mineral soils | –1.6221*** | 0.2058 |
| Site VI, mineral soils | –3.0 b | -- |
| Site VII, mineral soils | –1.0172*** | 0.2146 |
| Sites I–II, spruce mires | –1.5157*** | 0.2843 |
| Sites III, spruce mires | –0.5228*** | 0.1223 |
| Sites IV, spruce mires | –0.7371*** | 0.2022 |
| Sites I–III, pine mires | –0.8469*** | 0.2227 |
| Site IV, pine mires | –0.7566*** | 0.1356 |
| Site V, pine mires | –1.9882*** | 0.2138 |
| Site VI–VII, pine mires | –3.0 b | -- |
| Site VIII, poorly productive land | 1.3769*** | 0.2227 |
| Site VIII, waste land | 0.2147 | 0.3191 |
| Pine on sites II–III, mineral soils & mires c | 0.1309** | 0.0551 |
| Deciduous trees on sites I–II, mineral soils & mires c | –0.4619* | 0.1633 |
| Stand age (years) | 0.0142*** | 0.0014 |
| Stand age2/1000 (years) | –0.0422*** | 0.0059 |
| Stand basal area (m2 ha–1) | 0.1138*** | 0.0090 |
| Stand basal area2 (m2 ha–1) | –0.0023*** | 0.0002 |
| Variance components at cluster level (N = 912) | 0.3712 | |
| Snowdon’s bias correction ratio | 1.12 | |
| Pearson correlation coefficient (predicted vs measured) | 0.61 | |
| Proportion of explained variance R2 | 37.1% | |
| Root mean square error RMSE (relative RMSE) | 10.7 (116%) | |
| a = Site III on mineral soils was the reference. b = Not estimated due to few or no observations, and ad-hoc parameters were set. c = Spruce as the dominant tree species was the reference. *, **, *** = Significant at the 0.05, 0.01 and 0.001 levels, respectively. | ||
| Table 3. Parameter estimates and goodness-of-fit statistics of the multi-level quasi-Poisson models estimated for the percentage cover of lingonberry in the Finnish PSP3000 data (N = 2199). Sites I–VIII refer to different site quality classes (see Table 1). | ||
| Variable | Estimate | Std. error |
| Intercept | 2.1192*** | 0.0960 |
| Site I, mineral soils | –2.8116*** | 0.4719 |
| Site II, mineral soils | –1.3939*** | 0.1083 |
| Site III, mineral soils | –0.2216*** | 0.0556 |
| Site IV, mineral soils | 0.0 a | -- |
| Site V, mineral soils | –0.3011** | 0.1051 |
| Site VI, mineral soils | –0.3 b | -- |
| Site VII, mineral soils | –0.3 b | -- |
| Sites I–II, spruce mires | –1.2713*** | 0.2226 |
| Sites III, spruce mires | –0.5535*** | 0.1378 |
| Sites IV, spruce mires | –0.3888* | 0.1733 |
| Sites I–III, pine mires | –0.8543*** | 0.1825 |
| Site IV, pine mires | –0.4815*** | 0.0958 |
| Site V, pine mires | –1.2542*** | 0.1181 |
| Site VI–VII, pine mires | –2.8 b | -- |
| Site VIII, poorly productive land | –0.4973* | 0.2392 |
| Site VIII, waste land | –1.5922*** | 0.4142 |
| Spruce on sites I–III, mineral soils & spruce mires c | –0.2273*** | 0.0614 |
| Deciduous trees on sites I–III, mineral soils & spruce mires c | –0.3203*** | 0.0888 |
| Altitude (m) | –0.0029*** | 0.0005 |
| ln(Temperature sum/1000) (dd) | –1.4225*** | 0.2289 |
| Stand age (years) | 0.0050*** | 0.0013 |
| Stand age2/1000 (years) | –0.0193*** | 0.0053 |
| Stand basal area (m2 ha–1) | 0.0635*** | 0.0078 |
| Stand basal area2 (m2 ha–1) | –0.0016*** | 0.0002 |
| Variance components at cluster level (N = 912) | 0.1975 | |
| Snowdon’s bias correction ratio | 1.06 | |
| Pearson correlation coefficient (predicted vs measured) | 0.50 | |
| Proportion of explained variance R2 | 25.0% | |
| Root mean square error RMSE (relative RMSE) | 6.6 (98%) | |
| a = Site IV on mineral soils was the reference. b = Not estimated due to few or no observations, and ad-hoc parameters were set. c = Pine as the dominant tree species was the reference. *, **, *** = Significant at the 0.05, 0.01 and 0.001 levels, respectively. | ||
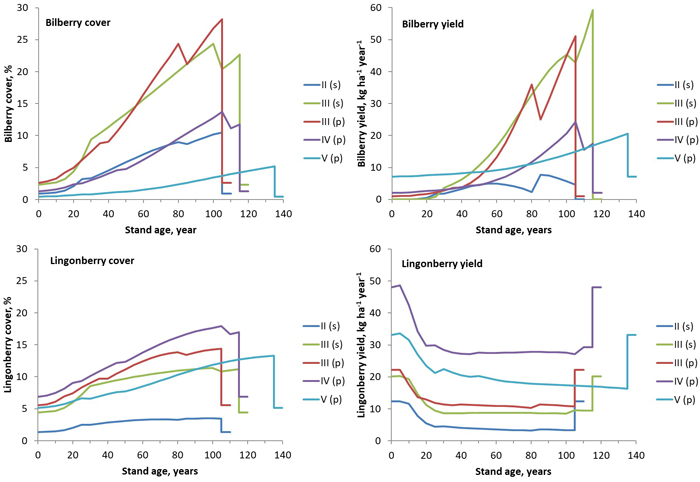
Fig. 1. Simulated cover (left) and yield (right) of bilberry (above) and lingonberry (below) in stands in different fertility classes in Sodankylä in North Finland. The full rotation periods including a final cut at the end were simulated. Site fertility: II = herb-rich sites, III = mesic sites, IV = sub-xeric sites, and V = xeric sites. Dominant tree species: s = spruce, p = pine. View larger in new window/tab.
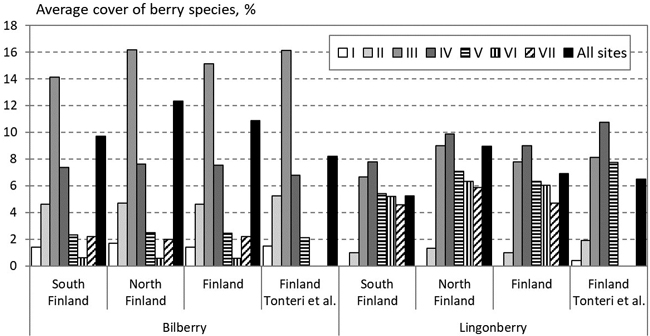
Fig. 2. The average cover of bilberry (left) and lingonberry (right) in different site types on mineral soils predicted based on the NFI12 data in South and North Finland and the whole country and measured in the whole country by Tonteri et al. (2005). The data for Sites VI and VII were not presented by Tonteri et al. (2005).
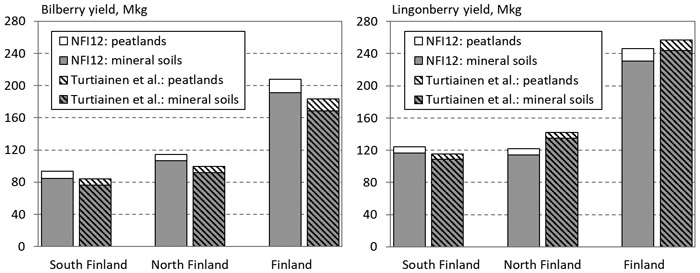
Fig. 3. The total annual yield of bilberry (left) and lingonberry (right) in forest land in South and North Finland, and the whole country. Prediction based on the NFI12 data and estimated by Turtiainen et al. (2005, 2007).
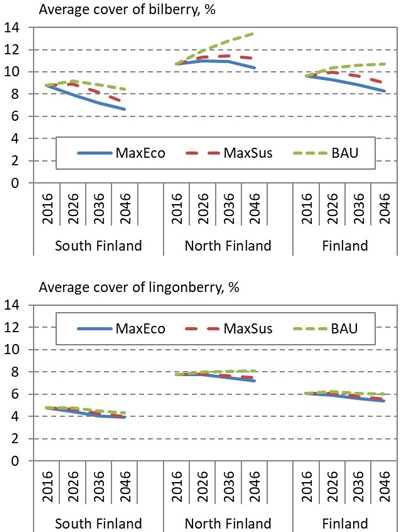
Fig. 4. Development of the average cover of bilberry (above) and lingonberry (below) in South and North Finland and the whole country, according to alternative 30-year regional forest scenarios: Maximum economic removal (MaxEco); Maximum sustainable yield (MaxSus); and Realised cutting removals (BAU).
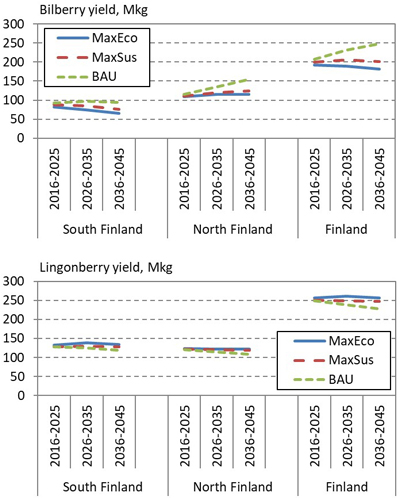
Fig. 5. Development of the total annual yield of bilberry (above) and lingonberry (below) in South and North Finland, and the whole country, according to the NFI12 data and alternative 30-year regional forest scenarios: Maximum economic removal (MaxEco); Maximum sustainable yield (MaxSus); and Realised cutting removals (BAU).
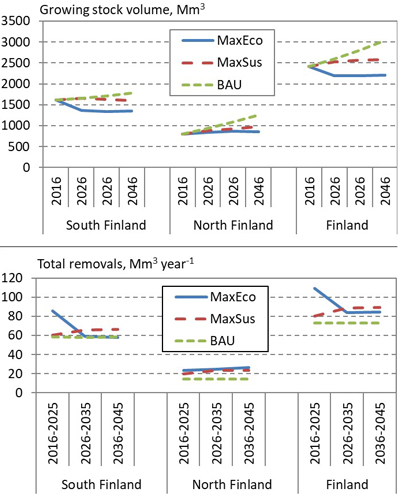
Fig. 6. Development of the volume of growing stock (above) and removals (below) in South and North Finland, and the whole country, according to the NFI12 data and alternative 30-year regional forest scenarios: Maximum economic removal (MaxEco); Maximum sustainable yield (MaxSus); and Realised cutting removals (BAU).
| Table 4. Estimated percent cover (%) of bilberry and lingonberry in productive forest land in Sweden (including conservation areas). The values are the averages of cover estimated between 2010 and 2019, and are weighted by area. CV = coefficient of variation. | ||||||||||
| Bilberry cover (%) | Lingonberry cover (%) | |||||||||
| NNorr | SNorr | Svea | Göta | Sweden | NNorr | SNorr | Svea | Göta | Sweden | |
| Mean | 13.8 | 12.6 | 10.2 | 7.1 | 11.2 | 10.6 | 8.6 | 6.4 | 3.1 | 7.5 |
| SD | 0.9 | 1.9 | 1.1 | 1.1 | 0.7 | 1.2 | 1.3 | 0.6 | 0.7 | 0.5 |
| CV | 0.07 | 0.15 | 0.11 | 0.16 | 0.07 | 0.11 | 0.16 | 0.09 | 0.23 | 0.07 |
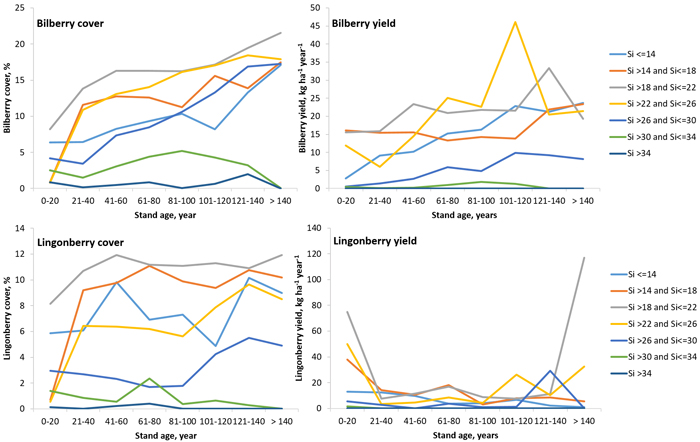
Fig. 7. The average estimated cover (left) and yield (right) of bilberry (above) and lingonberry (below) in different site indices (Si) and stand age classes based on the Swedish NFI data from 2015–2019. View larger in new window/tab.
| Table 5. Estimated total annual yield of bilberry and lingonberry in productive forest land in Sweden (including conservation areas). NNorr = North Norrland, SNorr = South Norrland, Svea = Svealand, Göta = Götaland. CV = coefficient of variation. | ||||||||||
| Bilberry (Mkg) | Lingonberry (Mkg) | |||||||||
| Year | NNorr | SNorr | Svea | Göta | Sweden | NNorr | SNorr | Svea | Göta | Sweden |
| 2015 | 193 | 162 | 110 | 96 | 565 | 95 | 144 | 63 | 108 | 410 |
| 2016 | 194 | 179 | 91 | 58 | 522 | 253 | 195 | 138 | 8 | 595 |
| 2017 | 160 | 36 | 21 | 22 | 238 | 278 | 296 | 39 | 25 | 637 |
| 2018 | 95 | 77 | 41 | 3 | 216 | 25 | 65 | 15 | 3 | 107 |
| 2019 | 62 | 34 | 25 | 21 | 142 | 45 | 46 | 46 | 22 | 159 |
| Mean | 141 | 98 | 58 | 40 | 336 | 139 | 149 | 60 | 33 | 382 |
| SD | 60 | 69 | 40 | 37 | 193 | 118 | 102 | 47 | 43 | 243 |
| CV | 0.42 | 0.70 | 0.70 | 0.93 | 0.57 | 0.85 | 0.68 | 0.78 | 1.30 | 0.64 |
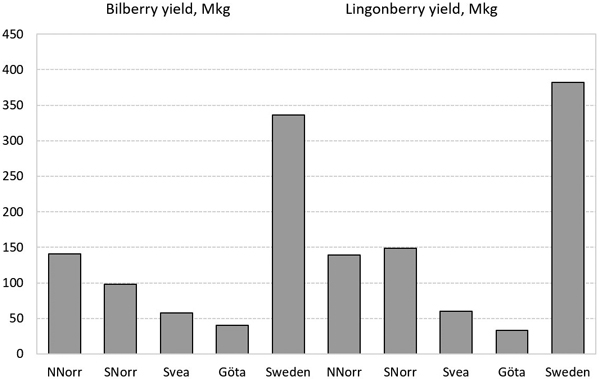
Fig. 8. The average of estimated total annual yields between 2015 and 2019 in productive forest land in Sweden (including conservation areas). NNorr = North Norrland, SNorr = South Norrland, Svea = Svealand, Göta = Götaland.