| Table 1. Forest variables and the number of pixels per plot used in the analyses. Basal area weighted DBH (DBHB), mean height of dominant trees (H), stem number (N trees), basal area (BA), effective plant area index (PAIeff) and number of pixels of the airborne hyperspectral data used per plot (N pixels). The plots were located within approximately 3 km from each other. | |||||||
| Plot | Species | DBHB, cm | H, m | N trees, ha–1 | BA, m2 ha–1 | PAIeff, m2 m–2 | N pixels |
| Pine 1 | Pinus sylvestris | 20.4 | 18.7 | 688 | 19.9 | 1.68 | 905 |
| Pine 2 | Pinus sylvestris | 16.6 | 16.4 | 1760 | 28.0 | 2.14 | 1137 |
| Pine 3 | Pinus sylvestris | 21.6 | 22.9 | 992 | 33.0 | 2.20 | 1139 |
| Pine 4 | Pinus sylvestris | 30.3 | 25.1 | 272 | 17.6 | 1.30 | 689 |
| Birch 1 | Betula pendula, B. pubescens | 14.0 | 18.6 | 1520 | 19.5 | 2.37 | 916 |
| Birch 2 | Betula pendula, B. pubescens | 20.0 | 23.2 | 416 | 11.5 | 1.48 | 641 |
| Birch 3 | Betula pendula, B. pubescens | 17.4 | 21.3 | 1184 | 22.9 | 2.56 | 1264 |
| Birch 4 | Betula pendula, B. pubescens | 12.0 | 17.2 | 1904 | 16.8 | 2.44 | 759 |
| Spruce 1 | Picea abies | 28.5 | 26.2 | 512 | 29.8 | 2.49 | 879 |
| Spruce 2 | Picea abies | 44.8 | 34.3 | 368 | 46.0 | 3.25 | 744 |
| Spruce 3 | Picea abies | 21.8 | 21.9 | 672 | 22.0 | 2.22 | 636 |
| Spruce 4 | Picea abies | 29.7 | 26.0 | 400 | 22.9 | 2.84 | 688 |
| Spruce 5 | Picea abies | 30.1 | 26.5 | 624 | 38.6 | 3.41 | 874 |
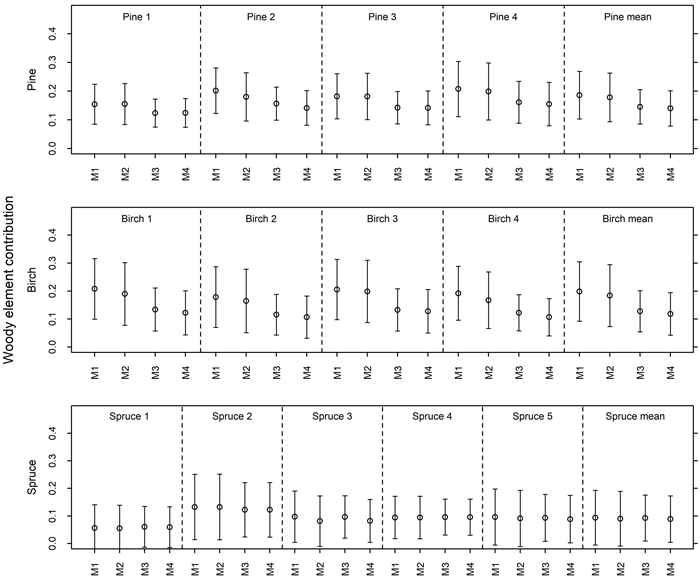
Fig. 1. Contribution of woody elements to tree level reflectance based on four different models (M1 = Model 1, M2 = Model 2, M3 = Model 3, M4 = Model 4). Models 1–2 were estimated using Eq. 1 and Models 3–4 using Eq. 2. In Models 2 and 4, direct forest floor contribution was extracted from pixel reflectance before fitting the model. View larger in new window/tab.
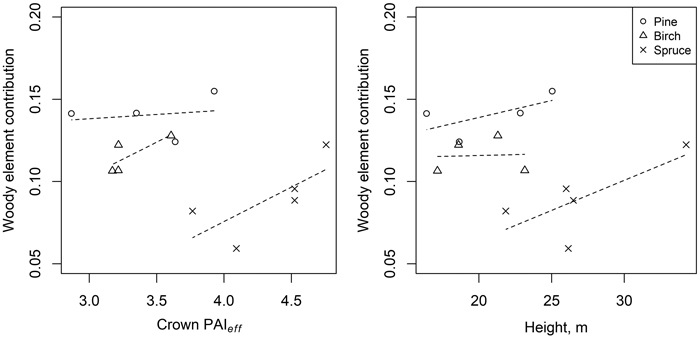
Fig. 2. Relationships between woody element contribution and effective plant area per vertical crown projection area (crown PAIeff) (left) and tree height (right), based on Model 4 (woody element contribution estimated using Eq. 2, with direct forest floor contribution first extracted from pixel reflectance).