| Table 1. Summary statistics of modelling data to test parameter recovery method of Weibull distribution and to develop Näslund’s height curve model for hybrid aspen (Populus tremula × P. tremuloides) from southern Finland. | |
| Variables | Statistics, Mean ± SD (Min–Max) |
| Dataset structure | |
| No. of stands | 4 |
| No. of plots | 48 |
| No. of sample trees | 4481 |
| No. of measurements by stand | 7–12 |
| No. of observations at plot-level instances | 294 |
| No. of observations at tree-level instances | 26 933 |
| Stand characteristics | |
| Stand age (AGE, years) | 5–20 |
| Stand density (TPH, trees ha−1) | 930 ± 423 (300–1600) |
| Basal area (BA, m2 ha−1) | 10.8 ± 9.0 (0.1–35.7) |
| Diameter, arithmetic mean (D, cm) | 11.1 ± 5.6 (1.5–24.9) |
| Diameter, basal area-weighted mean (DG, cm) | 12.0 ± 5.7 (2.1–26.8) |
| Diameter, median (DM, cm) | 11.3 ± 5.8 (1.2–26.0) |
| Diameter, basal area median (DGM, cm) | 12.1 ± 5.8 (1.9–26.6) |
| Diameter, quadratic mean (DQ, cm) | 11.4 ± 5.6 (1.8–25.4) |
| Height, basal area-weighted mean (HG, m) | 13.5 ± 6.6 (3.6–27.6) |
| Dominant height (HDOM, m) | 15.1 ± 6.7 (4.0–29.8) |
| Site index a (SI, m) | 25.5 ± 2.7 (17.5–29.9) |
| Tree characteristics | |
| Diameter at breast height (dbh, cm) | 10.8 ± 5.7 (0.1–31.8) |
| Height (h, m) | 13.6 ± 6.8 (1.4–31.4) |
| a: Site index was computed based on Lee et al. (2021) with a base age of 20 years. | |
| Table 2. The goodness-of-fit statistics for the recovered Weibull functions using arithmetic mean (D), basal area weighted mean (DG), median (DM), and basal area median dbh (DGM) for resolving the parameters based on the data of hybrid aspen (Populus tremula × P. tremuloides) from southern Finland. The smaller the value of test criterion, the better the fit. The values are mean ± standard deviation with minimum-maximum in parentheses. | ||||
| Variable | Kolmogorov-Smirnov quotient | Rejection cases of Kolmogorov-Smirnov at 10% level | The proportion of rejected cases to 294 total cases (%) | Error index by Reynolds et al. (1988) |
| D | 0.535 ± 0.232 (0.054–1.478) | 15 | 5.1 | 23.29 ± 11.52 (0.67–56.43) |
| DG | 0.507 ± 0.213 (0.134–1.425) | 8 | 2.7 | 22.75 ± 11.19 (2.67–60.31) |
| DM | 1.463 ± 2.673 (0.175–29.528) | 101 | 34.4 | 50.73 ± 58.38 (4.83–470.71) |
| DGM | 0.675 ± 0.741 (0.064–11.212) | 37 | 12.6 | 26.41 ± 13.11 (1.39–91.62) |
| Note: Kolmogorov-Smirnov quotient is the supremum divided by the critical value. | ||||
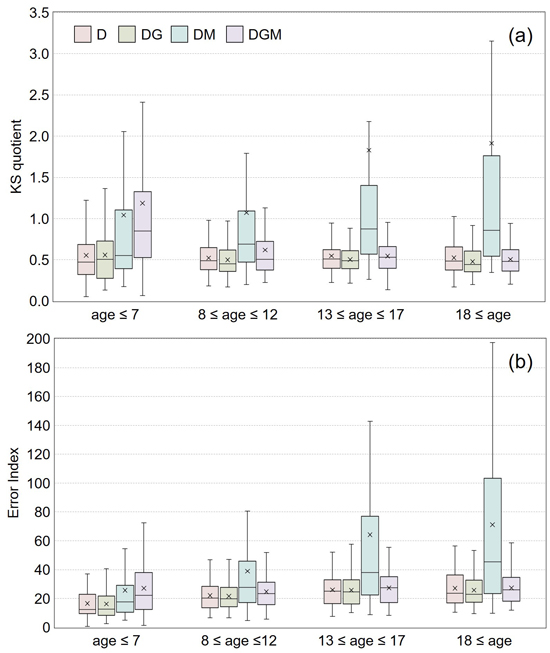
Fig. 1. Box and whisker plots of Kolmogorov-Smirnov quotient (KSq, plot a) statistics and Error Index (EI, plot b) by parameter recovery method of Weibull function for diameter distribution of hybrid aspen (Populus tremula × P. tremuloides) in southern Finland. The colour legend indicates different diameter types: D is the arithmetic mean diameter (cm); DG is the basal area-weighted mean diameter (cm); DM is the median diameter (cm); DGM is the basal area median diameter (cm). Each symbolic shape indicates the specific statistic as follows: the centre horizontal solid line inside the box is the median; the × mark is the mean; the lower boundary of the box is the 1st quartile (Q1); the upper boundary of the box is the 3rd quartile (Q3); the vertical length of the box is the interquartile range (IQR, Q3–Q1); the minimum value within the lower whisker below the box is the smallest observation above Q1–1.5×IQR; and the maximum value within the upper whisker above the box is the largest observation below Q3+1.5×IQR.
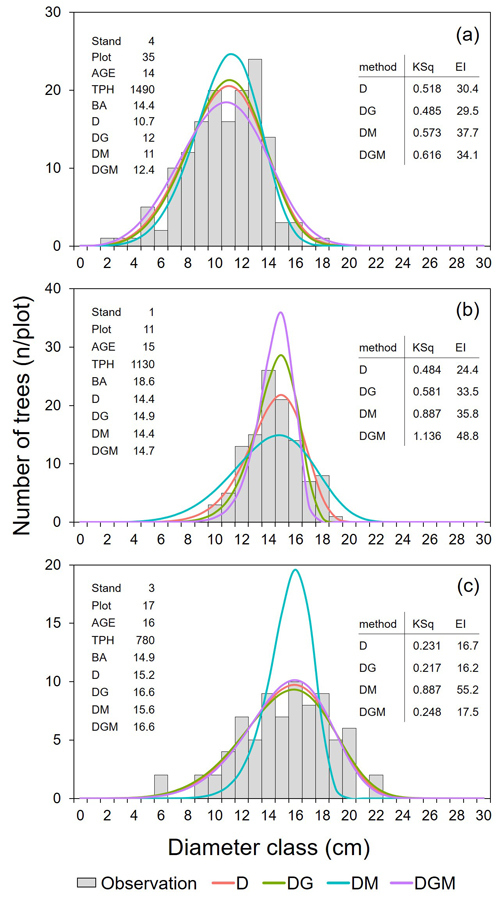
Fig. 2. Examples of the recovered Weibull distributions for three plots with fit statistics in clonal hybrid aspen (Populus tremula × P. tremuloides) plantations in southern Finland. The stand characteristics of each case are presented together on the left of the subplot. The fit statistics corresponding to each case are provided on the right with KSq and EI to compare the diameter types for the recovery method of Weibull distribution. KSq is the Kolmogorov-Smirnov quotient (supremum/critical value). EI is the Error Index (Reynolds et al. 1988). All the other abbreviations indicate stand characteristics as follows: AGE is the stand age (year); TPH is the number of trees per ha (trees ha−1); BA is the stand basal area (m2 ha−1); D is the arithmetic mean diameter (cm); DG is the basal area-weighted mean diameter (cm); DM is the median diameter (cm); DGM is the basal area median diameter (cm).
| Table 3. Parameter estimates and fit statistics for Näslund’s height curve models to predict individual tree height of hybrid aspen (Populus tremula × P. tremuloides) in southern Finland. | |||||||
| Model 1 | Model 2 | ||||||
| Estimate | S.E. | Estimate | S.E. | ||||
| Fixed effects | b0 | a0 | Intercept | −0.2531 | 0.0493 | 0.4180 | 0.0592 |
| a1 | ln(DG) | 0.4124 | 0.0229 | 0.3788 | 0.0204 | ||
| a2 | ln(HG) | −0.2723 | 0.0285 | −0.2585 | 0.0254 | ||
| a3 | ln(AGE) | −0.1683 | 0.0263 | −0.2184 | 0.0227 | ||
| a4 | ln(TPH) | −0.0658 | 0.0060 | ||||
| b1 | a0 | Intercept | −0.4411 | 0.0093 | 2.3409 | 0.0420 | |
| a1 | ln(DG) | 0.1277 | 0.0069 | −0.4653 | 0.0107 | ||
| a2 | ln(HG) | −0.4804 | 0.0100 | −0.5922 | 0.0093 | ||
| a3 | ln(AGE) | −0.0431 | 0.0082 | 0.0479 | 0.0071 | ||
| a4 | ln(BA) | −0.0156 | 0.0012 | 0.3039 | 0.0044 | ||
| a5 | ln(TPH) | −0.2880 | 0.0043 | ||||
| Random effects | u0 | std(experiment) | 0.0851 | 0.0663 | |||
| u1 | std(experiment) | 0.0097 | 0.0190 | ||||
| Corr(u0, u1) | –0.413 | –0.998 | |||||
| Residual | std(ε) | 0.2489 | 0.2719 | ||||
| Variance function | Power | 0.4459 | 0.3769 | ||||
| Fit statistics | AIC | 60 500.64 | 56 125.17 | ||||
| BIC | 60 615.46 | 56 256.38 | |||||
| –2logLik | 60 472.64 | 56 093.16 | |||||
| AIC is the Akaike information criterion. BIC is the Bayesian information criterion. –2logLik is the –2 × log-likelihood value. Corr is the correlation between random-effect parameters. All the fixed-effect parameters were highly significant (P < 0.0001). | |||||||
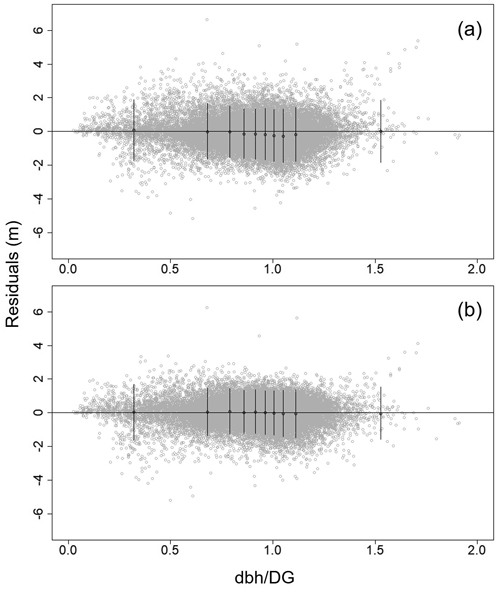
Fig. 3. Residual plots of Näslund’s Model 1 (a) and Model 2 (b) against the social status of a tree, dbh/DG to predict tree height of hybrid aspen (Populus tremula × P. tremuloides) in southern Finland. The selected variables and formulas are provided in Eqs. 11 and 12 for Model 1 (a), and Eqs. 13 and 14 for Model 2 (b). Note that here the residual analysis was performed only with fixed-effect parameters for general purposes. The whiskers were offered by the lmfor package in R statistical software to detect any bias (Mehtätalo 2015).
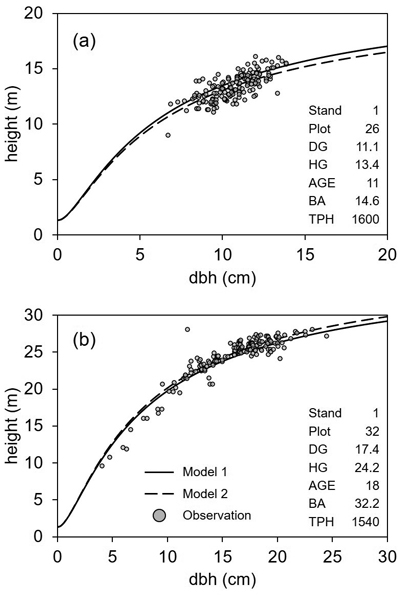
Fig. 4. Examples of the observed tree dimensions and the predicted height curves according to Näslund’s height models developed in this study for hybrid aspen (Populus tremula × P. tremuloides) in southern Finland. Note that the predictions are based on the fixed-effect parameters of Model 1 and Model 2 in Table 3. The stand characteristics of each case are shown together on the right of the plot and all the abbreviations are as follows: DG is the basal area-weighted mean diameter (cm); HG is the basal area-weighted mean height (m); AGE is the stand age (year); BA is the stand basal area (m2 ha−1); TPH is the number of trees per ha (trees ha−1).