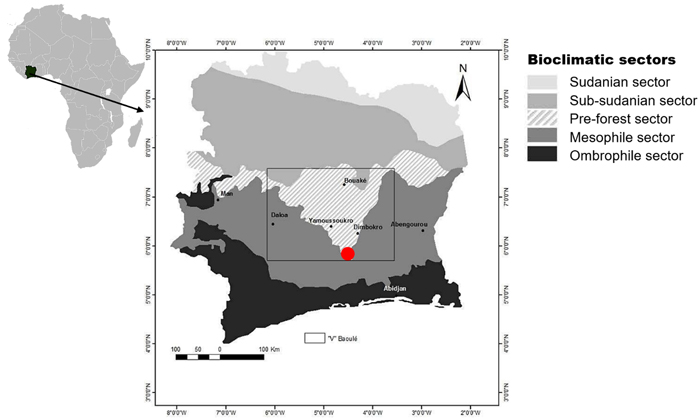
Fig. 1. Location of the study site: Lamto Scientific Reserve (in solid red circle), in Côte d’Ivoire. View larger in new window/tab.
| Table 1. Sampling criteria and number of trees and shrubs sampled per species. Among the five dominant woody species of LSR’s savanna, two (Crossopteryx febrifuga and Cussonia arborea) grow only in a typical single-stemmed tree, two (Piliostigma thonningii and Bridelia ferruginea) grow both as a single-stemmed tree or as a multi-stemmed shrub and one (Annona senegalensis) grows exclusively as a shrub. | |||||
| Species | Shrubs | Trees | Total | ||
| n | N | Db (cm) | N | ||
| A. senegalensis | 3–5 | 15 | - | - | 30 |
| A. senegalensis | 6–10 | 10 | - | - | |
| A. senegalensis | >10 | 5 | - | - | |
| B. Ferruginea | 3–5 | 15 | <10 | 10 | 55 |
| B. Ferruginea | 6–10 | 10 | 10–15 | 10 | |
| B. Ferruginea | >10 | 5 | >15 | 5 | |
| C. Febrifuga | - | - | <10 | 10 | 25 |
| C. Febrifuga | - | - | 10–15 | 10 | |
| C. Febrifuga | - | - | >15 | 5 | |
| C. arborea | - | - | <10 | 10 | 25 |
| C. arborea | - | - | 10–15 | 10 | |
| C. arborea | - | - | >15 | 5 | |
| P. thonningii | 3–5 | 15 | <10 | 10 | 55 |
| P. thonningii | 6–10 | 10 | 10–15 | 10 | |
| P. thonningii | >10 | 5 | >15 | 5 | |
| Total | 90 | 100 | N = 190 | ||
| n: number of stems per individual; N: number of samples; Db: stem basal diameter. | |||||
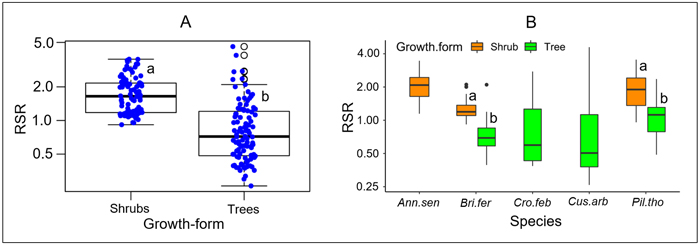
Fig. 2. Distribution of the root/shoot biomass ratio (RSR) according to its growth form. In Panel A, species are pooled according to their growth form; specific values are shown in panel B. The different box colors in panel B correspond to different growth forms. The lower-case letters next to box plots indicate, when different, groups of significantly different values at the 95% threshold according to Student’s t-test. At intraspecific level (panel B), comparison of RSR between growth forms was done only for species including both growth forms (tree and shrub). Plant species: Ann.sen (Annona senegalensis); Bri.fer (Bridelia ferruginea); Cro.fer (Crossopteryx febrifuga); Cus.arb (Cussonia arborea); Pil.tho (Piliostigma thonningii).
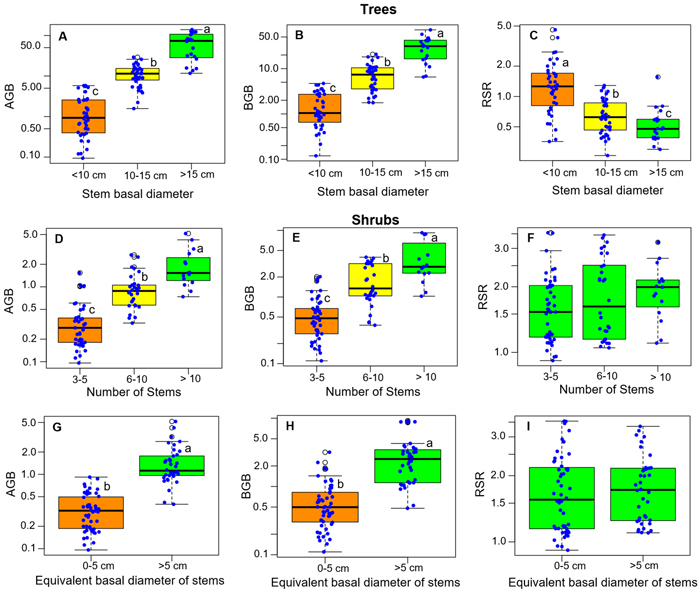
Fig. 3. Distribution of the total above- and belowground biomass (AGB and BGB) and of the root/shoot biomass ratio (RSR) according to classes of basal diameter, number of stems and stem equivalent basal diameter for shrubs. The box colors and lower-case letters next to box plots indicate, when different, groups of significantly different values at the 95% threshold according to Tukey’s HSD post-hoc test by class of each variable (panels 3A–3E) or to Student’s t-test (panels 3G–3I). View larger in new window/tab.
| Table 2. Effects of growth form, w (ρDb2H in g cm–1 m) and n (total number of stems) and their interaction on the estimation of the aboveground and belowground biomass (AGB and BGB) in Lamto trees and shrubs. For trees, Db (cm) corresponds to the stem basal diameter and H (m) represents the total height in the term ρDb2H. For shrubs, the term Db2H corresponds to the sum of di2hi (i = 1…n) of the n stems, where di (cm) and hi (m) are respectively the basal diameter and the total height of each stem. ρ (g cm–3) is the woody specific density. | ||||
| Dependent variables | Source of variation | Mean Sq | F value | P value |
| ln(AGB) | Growth form | 242.31 | 1021.72 | <0.001*** |
| ln(w) | 332.04 | 1400.05 | <0.001*** | |
| ln(n) | 11.07 | 46.68 | <0.001*** | |
| Growth form: ln(w) | 2.55 | 10.74 | <0.01** | |
| ln(BGB) | Growth form | 107.24 | 356.31 | <0.001*** |
| ln(w) | 214.84 | 713.83 | <0.001*** | |
| ln(n) | 23.10 | 76.75 | <0.001*** | |
| Growth form: ln(w) | 0.03 | 0.09 | >0.05 | |
| Table 3. Regression parameters of the fitted allometric models for predicting above- and belowground biomass (AGB and BGB in kg) of trees and shrubs measured in the Guinean savanna of Lamto Scientific Reserve. Variable w corresponds to the product ρDb2H (g cm–1 m) and variable n represents the total number of stems. For trees, Db (cm) corresponds to the stem basal diameter and H (m) represents the total height in the term ρDb2H. For shrubs, the term Db2H corresponds to the sum of di2hi (i = 1…n) of the n stems, where di (cm) and hi (m) are respectively the basal diameter and the total height of each stem. ρ (g cm–3) is the woody specific density. Values in brackets = standard error (se) of the estimated value; Adj-R2 = Adjusted R square; AIC = Akaike information criterion; CF = Correction factor due to logarithmic transformation; a, b and c are constants and represent the regression coefficients of the models. | |||||||
| Model | Regression coefficients | Adj-R2 | AIC | CF | |||
| a (se) | b (se) | c (se) | |||||
| Trees | ln(AGB) = a + b ln(w) | –3.2191 (0.18) *** | 0.9150 (0.03) *** | - | 0.90 | 176.19 | 1.1780 |
| ln(BGB) = a + b ln(w) | –2.2527 (0.18) *** | 0.6899 (0.03) *** | - | 0.82 | 181 | 1.1875 | |
| Shrubs | ln(AGB) = a + b ln(w) + c ln(n) | –4.0272 (0.17) *** | 0.6227 (0.06) *** | 0.9271 (0.09) *** | 0.84 | 80.27 | 1.0699 |
| ln(BGB) = a + b ln (w) + c ln(n) | –3.9059 (0.23) *** | 0.7205 (0.09) *** | 0.9920 (0.13) *** | 0.77 | 136.56 | 1.1347 | |
| Table 4. Difference between species of the regression parameters of the fitted allometric models for predicting above- and belowground biomass (AGB and BGB in kg) of trees and shrubs measured in the Lamto Scientific Reserve. Variable w corresponds to the product ρDb2H (g cm–1 m) and variable n represents the total number of stems. For trees, Db (cm) corresponds to the stem basal diameter and H (m) represents the total height in the term ρDb2H. For shrubs, the term Db2H corresponds to the sum of di2hi (i = 1…n) of the n stems, where di (cm) and hi (m) are respectively the basal diameter and the total height of each stem. ρ (g cm–3) is the woody specific density. Values in brackets = standard error (se) of the estimated value; Adj-R2 = Adjusted R square; CF = Correction factor due to logarithmic transformation; a, b and c are constants and represent the regression coefficients of the models. | |||||||
| Growth form | Model for biomass prediction | Species | Regression coefficients | Adj-R2 | CF | ||
| a (se) | b (se) | c (se) | |||||
| Trees | ln(AGB) = a + b ln(w) | B. ferruginea | –1.9674 (0.32) *** | 0.7226 (0.06) *** | - | 0.86 | 1.0822 |
| C. febrifuga | –4.1332 (0.24) *** | 0.1000 (0.04) *** | - | 0.96 | 1.1059 | ||
| C. arborea | –3.2339 (0.39) *** | 0.9374 (0.07) ** | - | 0.87 | 1.2743 | ||
| P. thonningii | –3.1290 (0.28) *** | 0.9167 (0.05) *** | - | 0.94 | 1.0293 | ||
| ln(BGB) = a + b ln(w) | B. ferruginea | –1.7230 (0.38) *** | 0.6116 (0.07) *** | - | 0.76 | 1.1176 | |
| C. febrifuga | –3.0946 (0.18) *** | 0.7650 (0.03) *** | - | 0.97 | 1.0564 | ||
| C. arborea | –1.8752 (0.40) *** | 0.5928 (0.08) ** | - | 0.71 | 1.2989 | ||
| P. thonningii | –2.1070 (0.26) *** | 0.7361 (0.05) *** | - | 0.91 | 1.0678 | ||
| Shrubs | ln(AGB) = a + b ln(w) + c ln(n) | A. senegalensis | –4.4805 (0.20) *** | 0.8738 (0.10) *** | 0.8865 (0.12) *** | 0.94 | 1.0264 |
| B. ferruginea | –3.3522 (0.24) *** | 0.7027 (0.07) *** | 0.5083 (0.12) *** | 0.86 | 1.0463 | ||
| P. thonningii | –4.2124 (0.20) *** | 0.1112 (0.13) >0.05 | 1.7147 (0.17) *** | 0.94 | 1.0293 | ||
| ln(BGB) = a + b ln (w) + c ln(n) | A. senegalensis | –4.5151 (0.37) *** | 1.0006 (0.19) *** | 1.0992 (0.22) *** | 0.86 | 1.0954 | |
| B. ferruginea | –3.4570 (0.29) *** | 0.8295 (0.08) *** | 0.5008 (0.14) ** | 0.84 | 1.0718 | ||
| P. thonningii | –3.8090 (0.37) *** | 0.3054 (0.24) >0.05 | 1.5140 (0.30) *** | 0.84 | 1.0989 | ||
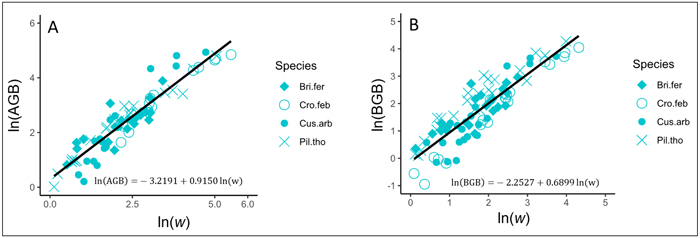
Fig. 4. Fits of the best models predicting the above- and belowground biomass (AGB and BGB) of trees in the savanna of the Lamto Scientific Reserve: A) Fit of the best model predicting AGB in trees; B) Fit of the best model predicting BGB in trees. AGB and BGB are well predicted from the variable w (g cm–1 m) = ρDb2H, where Db (cm) and H (m) represent the stem basal diameter and the stem total height, respectively; ρ (g cm–3) is the woody specific density. Tree species are shown with different symbols. View larger in new window/tab.
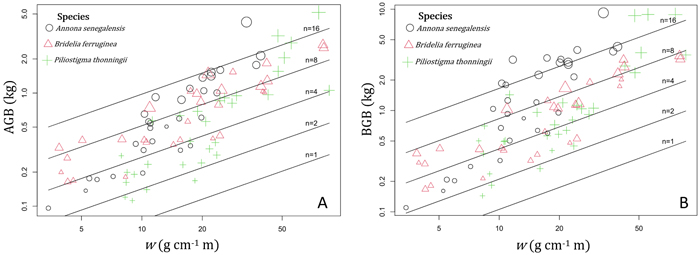
Fig. 5. Variation of the aboveground biomass (AGB) and belowground biomass (BGB) of shrubs according to the variable w = ρDb2H and the total number of stems (n). In the term ρDb2H, ρ (g cm–3) is the woody specific density and the term ρDb2H corresponds to the sum of di2hi (i = 1…n) of the n stems (with di = basal diameter in cm and hi = total height of each stem in m). The different symbols and color of data points correspond to the different shrub species, and the size of points is proportional to log(n). View larger in new window/tab.
| Table 5. Comparison of model accuracy between the allometric models fitted to trees and shrubs measurements of the savanna of Lamto Scientific Reserve and the allometric equations adjusted by Ifo et al. (2018) from trees measurements in the savanna of the Plateau Batéké in Congo basin. The variable w corresponds to the product ρDb2H (g cm–1 m), where Db (cm) and H (m) respectively represent the stem basal diameter and the total height in trees; and in shrubs the term Db2H corresponds to the sum of di2hi (i = 1…n) of the n stems (di = basal diameter in cm; hi = total height of each stem in m). ρ (g cm–3) is the woody specific density. Written alone, Db (cm) corresponds to the stem basal diameter for trees and to the equivalent basal diameter of stems for shrubs (see Eq. 1 for detail relative to the measure of the equivalent basal diameter in shrubs). | ||||
| Models fitted in this study | Ifo et al. (2018) models | |||
| Trees | Shrubs | Trees | Shrubs | |
| Model | AGB = 4.71 10–2 (w)0.9150 | AGB = 1.91 10–2 (w)0.6227 (n)0.9271 | AGB = 9.31 10–2 (w)0.9135 | |
| Model bias (%) | 19.04 | 1.48 | 132.48 | 78.76 |
| Model | BGB = 1.25 10–1 (w)0.6899 | BGB = 2.28 10–2 (w)0.7205 (n)0.9920 | BGB = 12.58 10–2 (ρDb2)0.8640 | |
| Model bias (%) | 6.04 | 2.70 | 2.65 | –14.05 |
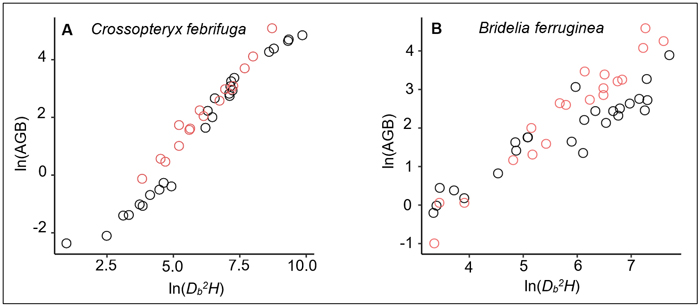
Fig. 6. Relationships between the aboveground biomass (AGB) and aboveground volume (Db2H) for: A) 41 Crossopteryx febrifuga trees and B) 44 Bridelia ferruginea trees. The black dots correspond to data measured in Lamto savannas, while the red dots represent the measured data in Ifo et al. (2018) study. The Ifo et al. data used here were extracted from the figure 4a of their study showing a plot of the aboveground biomass versus wood density times tree height times square diameter at the base for 88 trees from five species measured in the savannas of the Plateau Batéké in Congo. We extracted only data related to Crossopteryx febrifuga and Bridelia ferruginea (16 trees and 19 trees respectively); and Db2H were inferred from ρDb2H values.