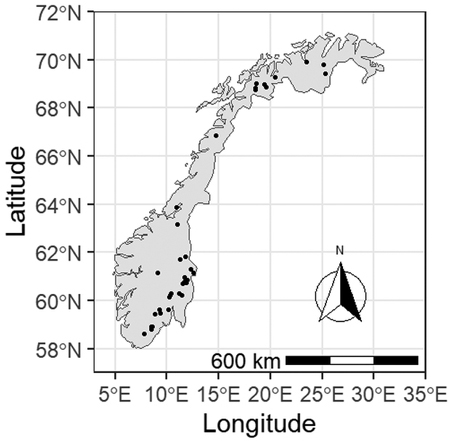
Fig. 1. Locations of Pinus sylvestris forest experimental sites used in this study. Sites from western Norway were excluded from the analysis due to the distinctly different climate of that region.
| Table 1. Summary statistics of stand-level metrics for thinned and unthinned plots of the model development dataset used in this study. Metrics were derived from even-aged Pinus sylvestris forests in Norway and comprise number of growth intervals (N), total stand age (AGE), site index for Scots pine at base age 40 (SI40), dominant height (HTDOM), number of trees per hectare (TPH), basal area (BA), total stem volume (VOL), age at thinning intervention (AGETHIN), and basal area removed at thinning (BAREM). Values refer to measurements at the beginning of a growth interval and SI40 was derived using the dominant height model developed in this study. | ||||||||||
| Treatment | N | AGE | SI40 | HTDOM | TPH | BA | VOL | AGETHIN | BAREM | |
| (year) | (m) | (m) | (# ha–1) | (m2 ha–1) | (m3 ha–1) | (year) | (m2 ha–1) | |||
| Unthinned | 250 | Mean | 51 | 11.2 | 13.9 | 2280 | 28 | 187 | ||
| SD | 15 | 2.5 | 3.6 | 1147 | 11.7 | 115 | ||||
| Min | 22 | 5.1 | 6.8 | 900 | 8.7 | 40 | ||||
| Max | 109 | 17.4 | 28.2 | 6080 | 56.5 | 620 | ||||
| Thinned | 781 | Mean | 55 | 11.6 | 15.3 | 1380 | 24.8 | 184 | 44 | 4.7 |
| SD | 15 | 2.4 | 4.2 | 633 | 8 | 96 | 11 | 3.3 | ||
| Min | 16 | 6.1 | 6.1 | 280 | 5.5 | 20 | 16 | 0.1 | ||
| Max | 109 | 18.2 | 28.7 | 4730 | 53.1 | 667 | 77 | 24.4 | ||
| Table 2. Abbreviations and definitions of the stand-level variables used in this work. Subscripts of 1 or 2 denote values at the beginning and the end of a measurement period, respectively. | |
| Abbreviation | Definition |
| AGE1,2 | Total stand age (years) |
| AGETHIN | Total stand age at the time of thinning (years) |
| BA1,2 | Total stand basal area (m2 ha–1) |
| BAAFTER | Total stand basal area after thinning (m2 ha–1) |
| BABEFORE | Total stand basal area before thinning (m2 ha–1) |
| BAREM | Total stand basal area removed in a thinning (m2 ha–1) |
| HTDOM | Dominant height (m) |
| HTTHIN | Dominant height at the time of thinning (m) |
| QMD1,2 | Quadratic mean diameter (cm) |
| SI40 | Site index (HTDOM at base stand age of 40 years, m) |
| TPH1,2 | Stem density (number of trees ha–1) |
| TPHAFTER | Stem density after thinning (number of trees ha–1) |
| TPHBEFORE | Stem density before thinning (number of trees ha–1) |
| VOL1,2 | Total stem volume over bark (m3 ha–1) |
| Table 3. Parameter estimates (standard errors) and model fit statistics including mean error (ME), mean absolute error (MAE), and relative MAE (MAE%) for the individual components (Eqs. 5–9) of the stand-level growth and yield model for thinned and unthinned, even-aged Pinus sylvestris forests in Norway. Seemingly unrelated regression was used to derive parameter estimates. | |||||
| HTDOM2 | TPH2 | BA2 | VOL2 | TPHAFTER/TPHBEFORE | |
| βi1 | 68.41819 | –1.56856 | 1.46553 | 0.65394 | –1.91239 |
| (1.84110) | (0.12049) | (0.01025) | (0.01095) | (0.03209) | |
| βi2 | –24.04110 | 0.00284 | 0.52449 | 0.96928 | 1.94414 |
| (1.82025) | (0.00489) | (0.01996) | (0.00330) | (0.03759) | |
| βi3 | 1.46991 | 4.14779 | 0.17701 | 0.91504 | |
| (0.01026) | (0.25666) | (0.00978) | (0.00406) | ||
| βi4 | 4.87715 | 16.53755 | –2.05278 | ||
| (0.23971) | (1.07667) | (0.24101) | |||
| βi5 | –386.71670 | –0.06848 | |||
| (97.76230) | (0.00646) | ||||
| ME | 0.01458 | –0.11108 | 0.02192 | 0.13014 | –0.00041 |
| MAE | 0.34876 | 46.25402 | 0.74455 | 3.92983 | 0.03386 |
| MAE% | 2.18346 | 2.74474 | 2.71853 | 1.97324 | 5.17959 |
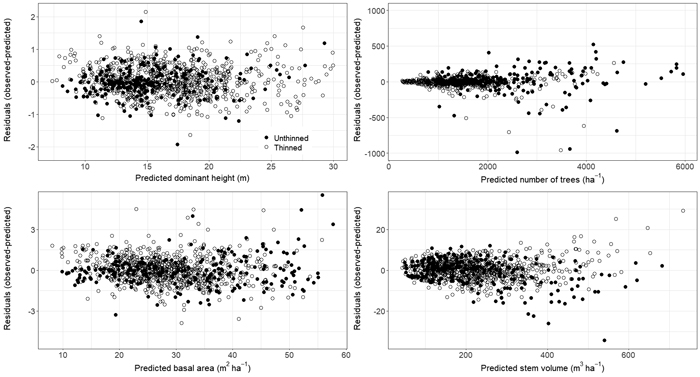
Fig. 2. Residual plots for Eqs. 5–8 representing HTDOM2, TPH2, BA2, and VOL2 of observations from thinned and unthinned plots. Eqs. 5–8 belong to the presented growth and yield model for single-species stands of Pinus sylvestris growing in Norway. View larger in new window/tab.
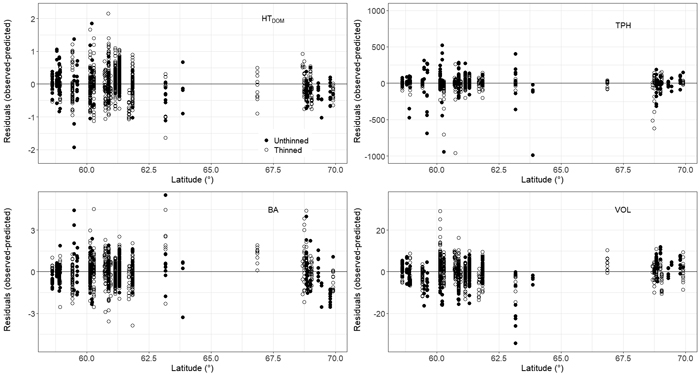
Fig. 3. Dominant height (HTDOM), trees per hectare (TPH), basal area (BA), and total stem volume (VOL) residuals (Eqs. 5–8) plotted over plot latitude for thinned and unthinned plots. Eqs. 5–8 belong to the presented growth and yield model for even-aged stands of Pinus sylvestris growing in Norway. View larger in new window/tab.
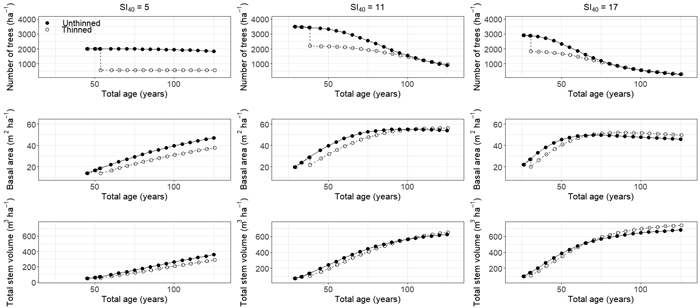
Fig. 4. Predictions in stem density, basal area, and total stem volume for three even-aged Pinus sylvestris stands in Norway representing different site indices (SI40 5, 11, and 17 representing dominant stand heights of 5, 11, and 17 m at age 40 years, respectively). Predictions were derived using 5 year prediction intervals and comprise different management scenarios including an unthinned treatment and a single thinning removing 25% of the basal area at 8, 10, or 12 m dominant stand height for SI40 5, 11, and 17, respectively. View larger in new window/tab.
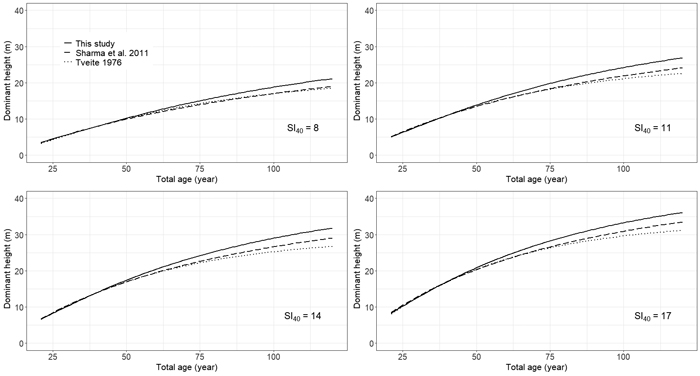
Fig. 5. Comparison of site-index (base age 40 years) curves for even-aged stands of Pinus sylvestris in Norway derived from Tveite (1976) and Sharma et al. (2011) and Eq. 5 of this study. View larger in new window/tab.
| Table 4. Prediction accuracy metrics including mean error (ME), mean absolute error (MAE), and relative MAE (MAE%) for predicted number of stems per hectare (TPH), basal area (BA), quadratic mean diameter (QMD), and total stem volume (VOL) as derived from this study’s component models as well as existing, previously published models for even-aged Pinus sylvestris stands in Norway. Fit statistics are presented for observations from thinned and unthinned permanent sample plots of this study’s model development dataset and an independent dataset from the Norwegian National Forest Inventory (NFI). | |||||||
| Component | Model | Unthinned | Thinned | ||||
| ME | MAE | MAE% | ME | MAE | MAE% | ||
| Model development dataset | |||||||
| TPH | This study | 5.6835 | 87.2168 | 3.9172 | –1.8884 | 33.6900 | 2.3851 |
| Eid & Øyen (2003) | –106.9901 | 135.1629 | 6.2082 | –26.4859 | 37.7290 | 2.6150 | |
| BA | This study | –0.0949 | 1.0599 | 3.5686 | 0.0639 | 0.8764 | 3.3289 |
| Brantseg (1969) | –1.4966 | 1.8999 | 5.7684 | –0.5530 | 1.1390 | 4.1720 | |
| QMD | This study (BA & TPH) | 0.0108 | 0.2529 | 1.8431 | 0.1238 | 0.3215 | 2.0004 |
| Blingsmo (1984) | 0.2010 | 0.3145 | 2.1849 | 0.2684 | 0.3709 | 2.3439 | |
| VOL | This study | –1.4335 | 9.6842 | 4.9385 | 1.2319 | 9.8617 | 4.8670 |
| Gizachew & Brunner (2011) | –28.0282 | 28.3641 | 12.1442 | –28.8161 | 29.0331 | 13.2350 | |
| Independent NFI dataset | |||||||
| TPH | This study | –14.7621 | 29.8658 | 3.1212 | –3.8224 | 14.5595 | 2.1439 |
| Eid & Øyen (2003) | –27.3764 | 27.8525 | 2.9961 | –9.6650 | 10.1904 | 1.5891 | |
| BA | This study | –0.3519 | 0.8225 | 4.6591 | 0.5458 | 0.8415 | 4.1951 |
| Brantseg (1969) | –0.4961 | 0.9223 | 5.0509 | 0.3200 | 0.7340 | 3.9558 | |
| QMD | This study (BA & TPH) | –0.0582 | 0.4344 | 2.5864 | 0.3087 | 0.5349 | 2.5887 |
| Blingsmo (1984) | –0.0688 | 0.3225 | 1.9894 | 0.3396 | 0.5242 | 2.5556 | |
| VOL | This study | –11.3532 | 12.7894 | 10.4393 | –3.5742 | 9.2175 | 5.6481 |
| Gizachew & Brunner (2011) | –16.3738 | 16.8886 | 13.5945 | –8.2044 | 11.6250 | 8.4833 | |