| Table 1. Basic characteristics of the study plots. Soil samples were taken from the plots for element analysis and weathering rate estimations. Tree species: Scots pine (Pinus sylvestris), Norway spruce (Picea abies). | |||||||||
| Plot/ location | Forest site type 1 | Tree species | Soil type 2 | Soil texture | Mafic minerals (%) 0.06–2 mm | Bedrock | Bulk density (g/cm3) 0–5 cm Undisturbed soil | Stoniness (%) | Age of soil formation (yrs) 3 |
| Karkkila/ 60°N, 24°E | Oxalis-Myrtillus type | spruce | Cambic podzol | Glacial till | 25 | Gabbro, diorite | 1.0 (0.6) 4 | 30 | 10000 |
| Tammela/ 60°N, 23°E | Vaccinium type | pine | Albic arenosol/ Haplic podzol | Sand | 12 | Granitic | 0.87 | 6 | 11500 |
| Utti/ 60°N, 26°E | Myrtillus type | spruce | Haplic arenosol/ podzol | Sand | 7 | Granitic | 1.3 | 0 | 10500 |
| Lapinjärvi/ 60°N, 26°E | Myrtillus type | spruce | Haplic arenosol/ podzol | Sand | 9 | Granitic, gneisses | 1.3 | 0 | 10500 |
| Evo/ 61°N, 25°E | Myrtillus type | spruce | Haplic arenosol/ podzol | Sand | 17 | Granitic, gneisses | 0.89 | 0 | 10500 |
| 1 Cajander (1949) 2 FAO/WRB (Mustajärvi et al. 2008; Merilä et al. 2014; Adamczyk et al. 2016; Lindroos et al. 2016a; Lindroos et al. 2016b) 3 According to Tanskanen and Ilvesniemi (2004); Korhonen (2008); Törmänen (2016) 4 Mechanically disturbed soil (ploughing) | |||||||||
| Table 2. Soil sample depths and soil horizons on the sample plots. Soil samples were taken from the soil horizons of the plots for element analysis and weathering rate estimations. Horizons sampled: E – eluvial horizon, B – illuvial horizon, BC – transition horizon between B and C, C – parent material. | ||
| Plot | Horizon | Depth (cm) |
| Karkkila | E | 0–4 |
| B | 4–10 | |
| B | 10–20 | |
| BC | 20–40+ | |
| Tammela | E | 0–3 |
| B | 3–6 | |
| BC | 6–36 | |
| C | 36+ | |
| Utti | E | 0–6 |
| B | 6–22 | |
| BC | 22–44 | |
| C | 44+ | |
| Lapinjärvi | E | 0–4 |
| B | 4–35 | |
| C | 35+ | |
| Evo | E | 0–3 |
| B | 3–24 | |
| C | 24+ | |
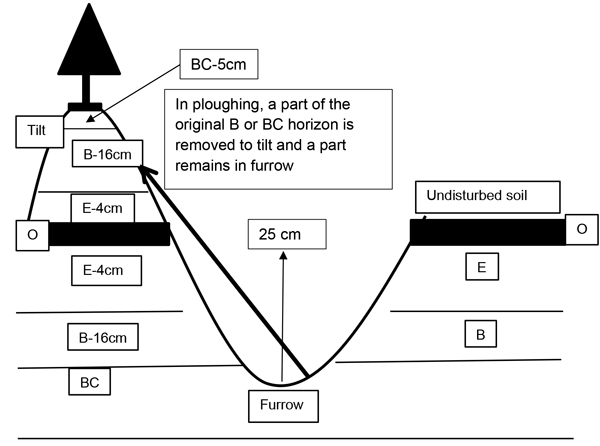
Fig. 1. After ploughing, the topmost mineral soil layer in tilt and furrow is BC-horizon. BC horizon (depth 0–5 cm) sample was taken from disturbed parts of the soil and total concentrations were compared to those in undisturbed BC horizon. Sampling was performed 17 years after ploughing (Lindroos et al. 2016a).
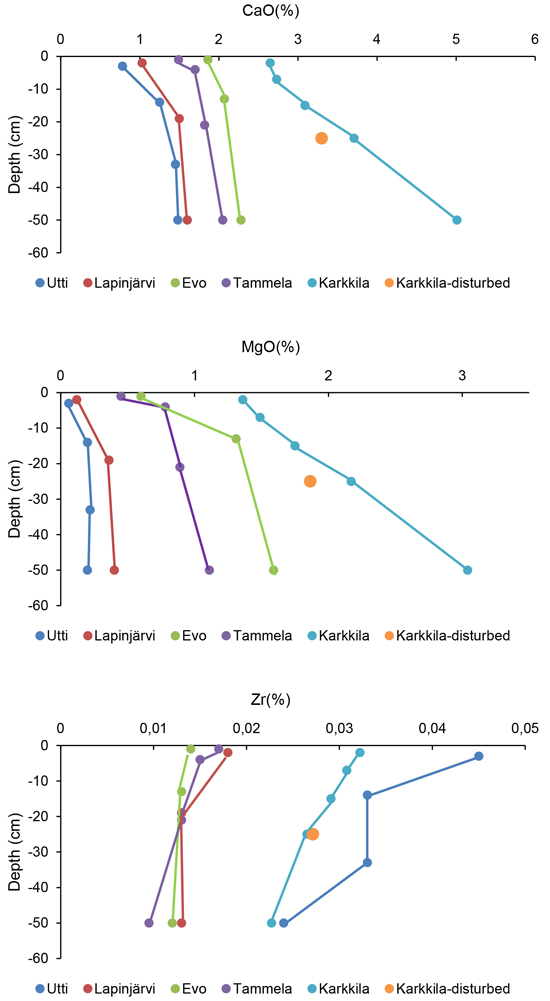
Fig. 2. The CaO, MgO and Zr concentrations with depth in undisturbed soils of the sample plots (Utti, Lapinjärvi, Evo, Tammela, Karkkila), and in the disturbed soil in the Karkkila experiment.
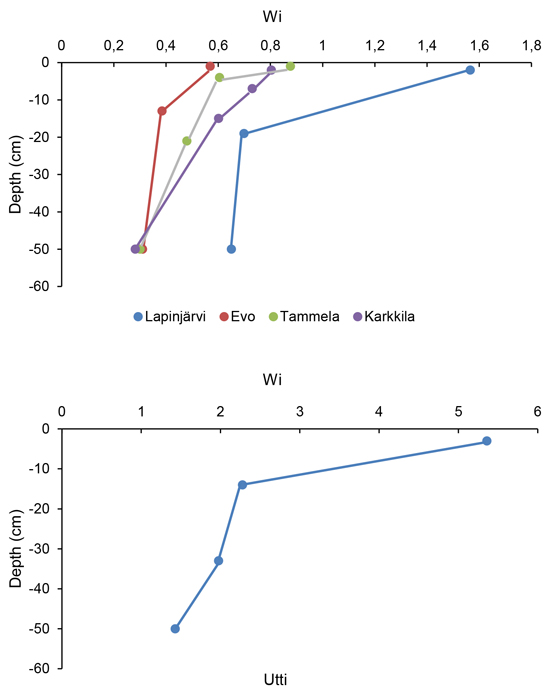
Fig. 3. Weathering index (Wi) with depth in undisturbed soil of the sample plots.
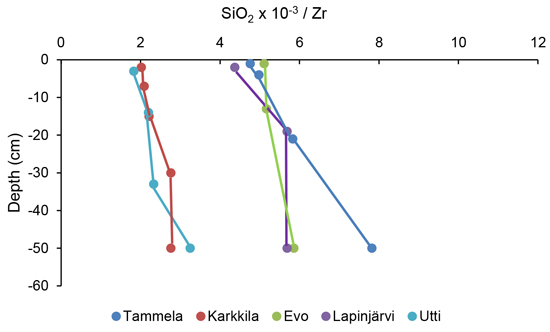
Fig. 4. SiO2 × 10–3 / Zr ratio with depth in undisturbed soils of the sample plots.
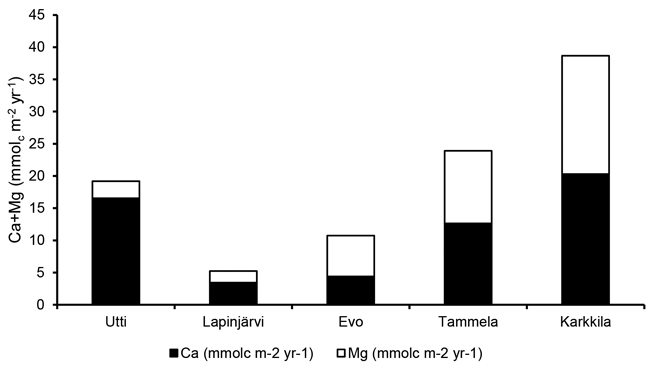
Fig. 5. Weathering rates of Ca and Mg (E+B/BC horizons) in the undisturbed soils of the sample plots.
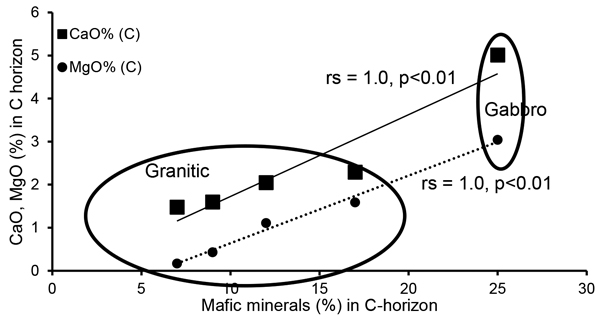
Fig. 6. The relationship between the mafic minerals and the concentrations of CaO and MgO in the C horizon on the sample plots. rs = Spearman’s rank correlation coefficient.
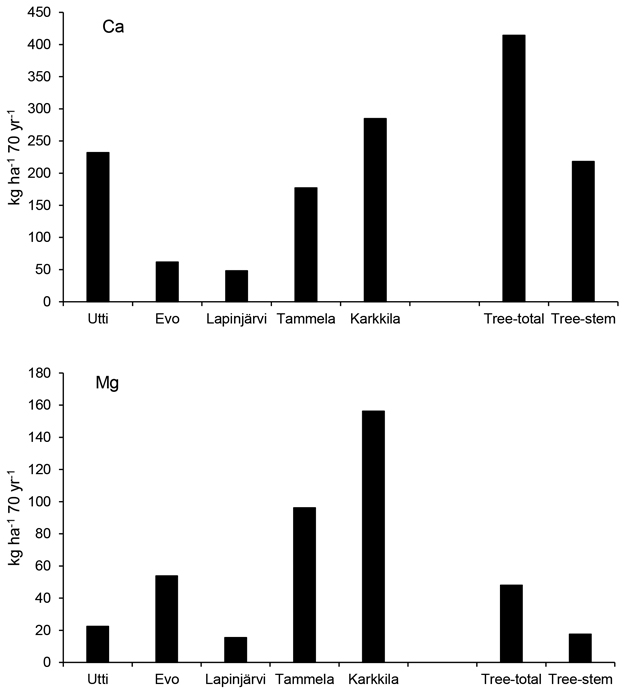
Fig. 7. The input of Ca and Mg in the soil (E+B/BC horizons) due to weathering in the sample plots during a period of 70 years (rotation period) in comparison to Ca and Mg amount in tree material in about 70-year-old spruce stands in southern Finland (Ukonmaanaho et al. 2008). Tree-total = nutrient amount in all above ground tree compartments. Tree-stem = nutrient amount in stem + bark.