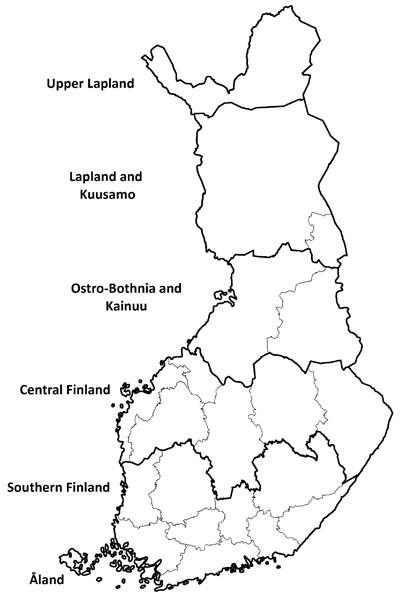
Fig. 1. The sampling regions (thick lines) applied in the 12th National Forest Inventory (NFI12) and regions (thin lines) of Finland.
| Table 1. Number of plot centers in the 12th National Forest Inventory (NFI12) of Finland for the old permanent, new permanent and temporary clusters by land use class. | ||||
| Land use class | Temporary clusters | Old permanent clustgers | New permanent clusters | Total |
| Productive forest | 17 454 | 11 232 | 16 912 | 45 598 |
| Poorly productive forest | 1553 | 982 | 1153 | 3688 |
| Unproductive land | 1664 | 894 | 1210 | 3768 |
| Other forestry land | 185 | 129 | 174 | 488 |
| Forestry land total | 20 856 | 13 237 | 19 449 | 53 542 |
| Agriculture land | 2659 | 1824 | 2469 | 6952 |
| Built-up land | 1147 | 721 | 1047 | 2915 |
| Roads | 330 | 224 | 322 | 876 |
| Power lines | 117 | 70 | 107 | 294 |
| Total | 25 109 | 16 076 | 23 394 | 64 579 |
| Table 2. Number of sample plots per cluster by sampling region in NFI12 of Finland. | ||
| Sampling region | Temporary clusters and new permanent clusters | Old permanent clusters |
| Southern Finland | 8 | 10 |
| Central Finland | 9 | 14 |
| Ostrobothnia and Kainuu | 8 | 11 |
| Lapland and Kuusamo | 10 | 11 |
| Table 3. Area of Finland by land use class (1000 ha) in 1921–2018. | |||||||
| NFI (years of measurement) | Productive forest | Poorly productive forest | Unproductive land | Other forestry land | Forestry land total | Other land | Land area total |
| NFI1 (1921–1924) | 18 032 1) | 4381 2) | 4471 | – | 26 844 | 3661 | 30 545 |
| NFI2 (1936–1938) | 17 085 1) | 4585 2) | 5004 | – | 26 674 | 3826 | 30 500 |
| NFI3 (1951–1953) | 17 352 1) | 4522 2) | 4441 | – | 26 315 | 4225 | 30 540 |
| NFI4 (1960–1963) | 16 909 1) | 4832 2) | 4492 | – | 26 233 | 4307 | 30 540 |
| NFI5 (1964–1970) | 18 697 | 3674 | 4226 | 70 | 26 667 | 3881 | 30 548 |
| NFI6 (1971–1976) | 19 738 | 3583 | 3371 | 86 | 26 778 | 3769 | 30 547 |
| NFI7 (1977–1984) | 20 065 | 3157 | 3049 | 103 | 26 374 | 4091 | 30 464 |
| NFI8 (1986–1994) | 20 074 | 2983 | 3093 | 151 | 26 301 | 4159 | 30 460 |
| NFI9 (1996–2003) | 20 338 | 2670 | 3156 | 154 | 26 317 | 4130 | 30 447 |
| NFI10 (2004–2008) | 20 085 | 2735 | 3259 | 184 | 26 263 | 4151 | 30 415 |
| NFI11 (2009–2013) | 20 267 | 2501 | 3228 | 198 | 26 193 | 4196 | 30 389 |
| NFI12 (2014–2018) | 20 276 | 2536 | 3224 | 210 | 26 247 | 4144 | 30 391 |
| 1) Well growing forest 2) Poorly growing forest | |||||||
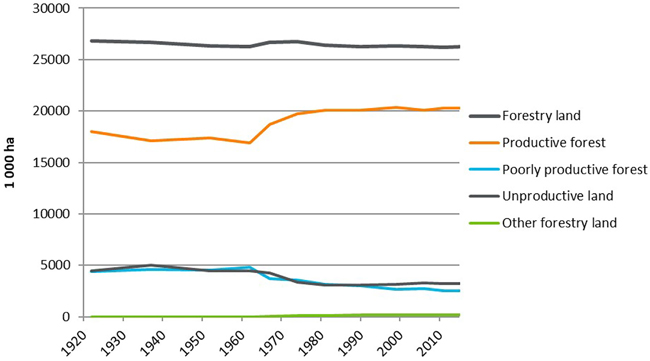
Fig. 2. Area (1000 ha) of Finland by land use classes 1921–2018.
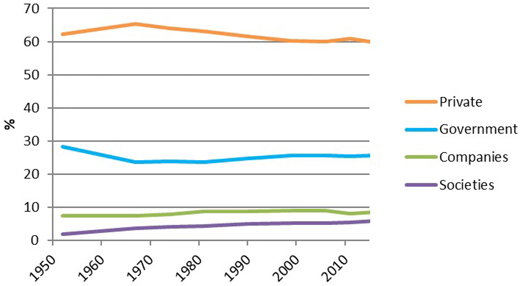
Fig. 3. The proportions of forest owner categories from the area of productive forests of Finland in 1951–2018.
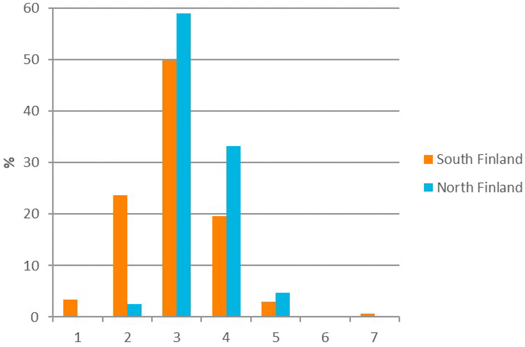
Fig. 4. The proportions of site fertility types (fertility classes) on mineral soils of the productive forest in South and North Finland according to NFI12: 1 = herb-rich forests, 2 = herb-rich heath forests, 3 = mesic heath forests, 4 = sub-xeric heath forests, 5 = xeric heath forests, 6 = barren heath forests, 7 = rocky and sandy soils and alluvial lands.
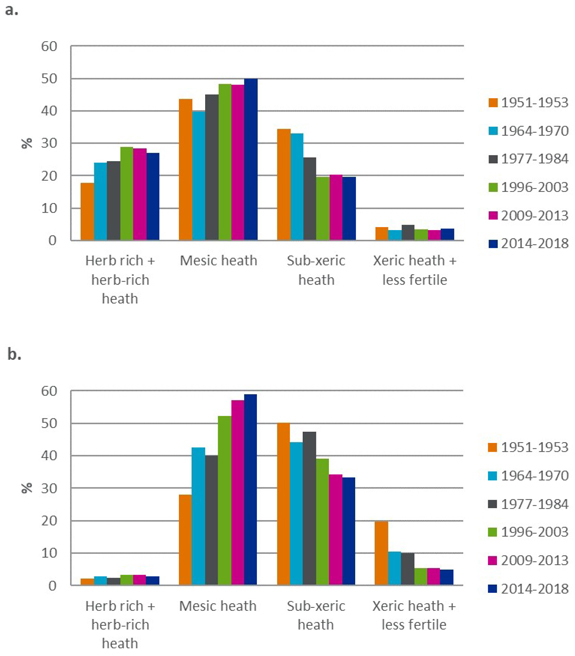
Fig. 5. The proportions of grouped site fertility types in productive forests on mineral soils in 1951–2018 a) in South Finland and b) in North Finland.
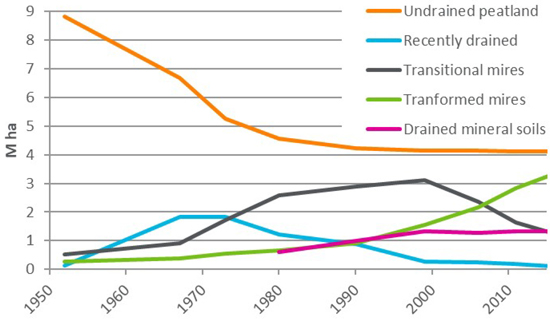
Fig. 6. Area of the drained mires by drainage stages and area of drained mineral soils in 1951–2018 in Finland.
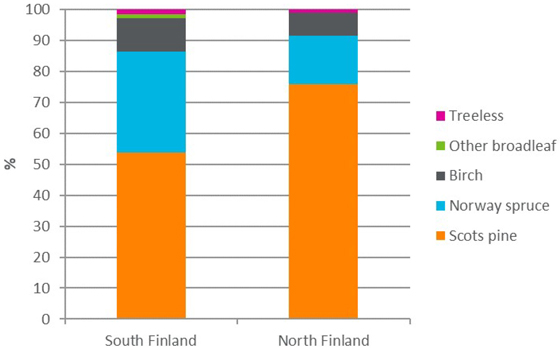
Fig. 7. Dominant tree species (Birch – Silver and downy birch) proportions of productive forest area according to NFI12 in South and North Finland.
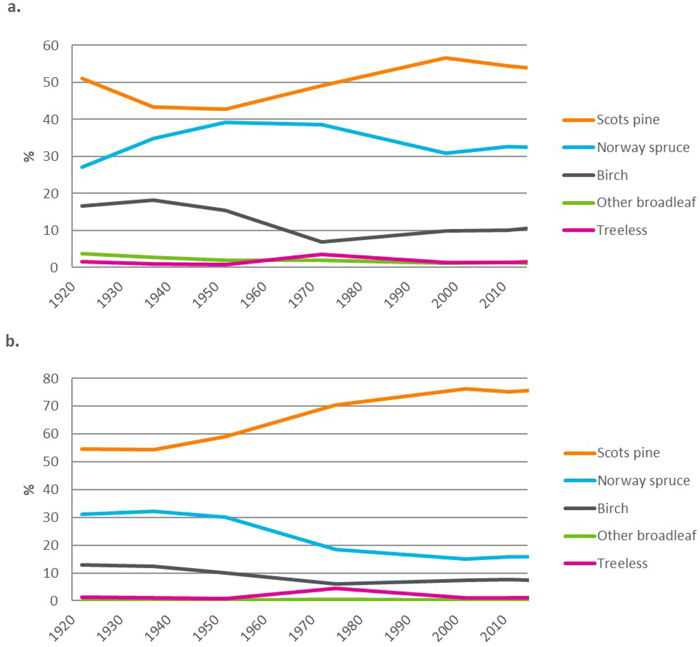
Fig. 8. Dominant tree species (Birch – Silver and downy birch) proportions of the productive forest area 1921–2018 in a) South Finland, and b) North Finland.
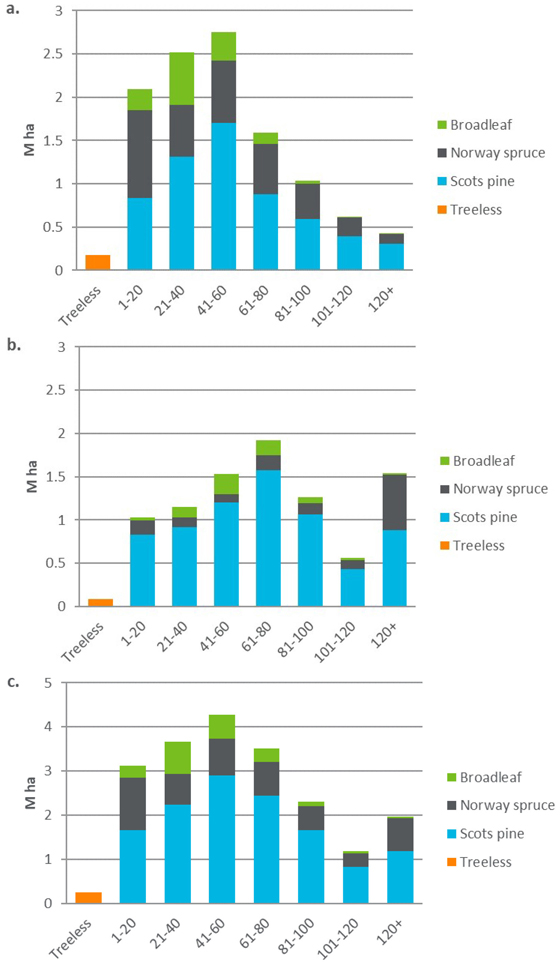
Fig. 9. Productive forest area (M ha) by age class and dominant tree species according to NFI12 in a) South Finland, b) North Finland, and c) the whole country.
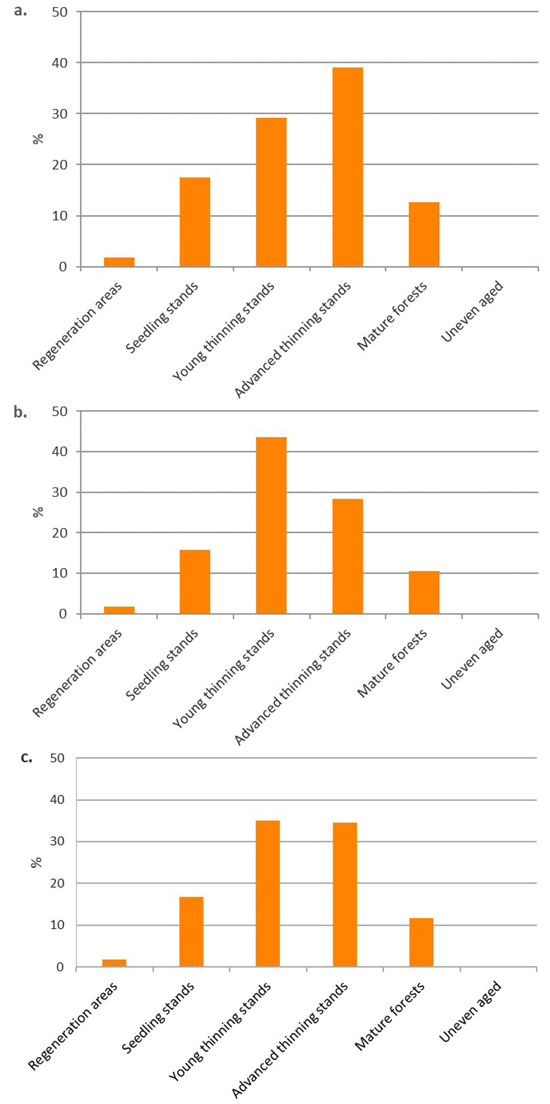
Fig. 10. The proportions of development classes of the productive forests available for wood supply according to NFI12 in a) South Finland, b) North Finland, and c) the whole country.
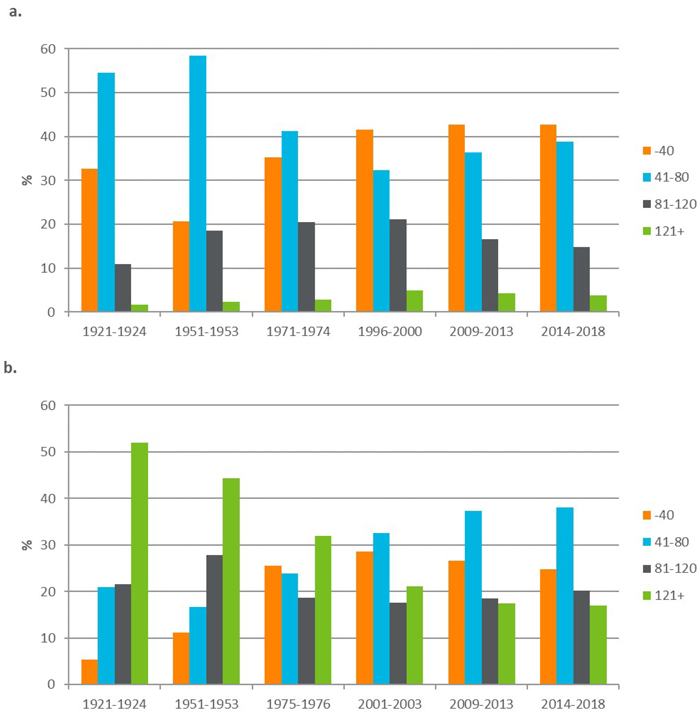
Fig. 11. The proportions of age groups (%) of the productive forest area 1921–2018 in a) South Finland and b) North Finland.
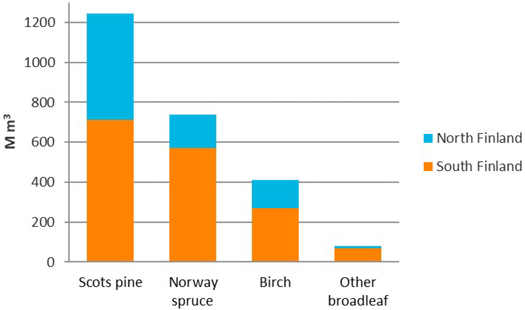
Fig. 12. Total volume of growing stock (M m3) by tree species according to NFI12 in South and North Finland.
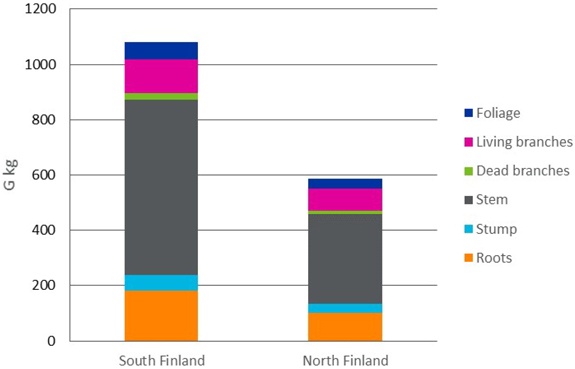
Fig. 13. Forest biomass (G kg) according to NFI12 in South and North Finland.
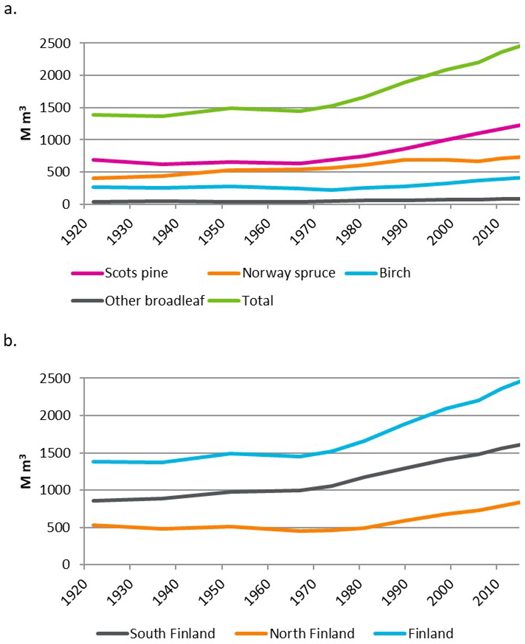
Fig. 14. The total volume of growing stock (M m3) in 1921–2018 a) by tree species, and b) in South Finland, North Finland and whole country.
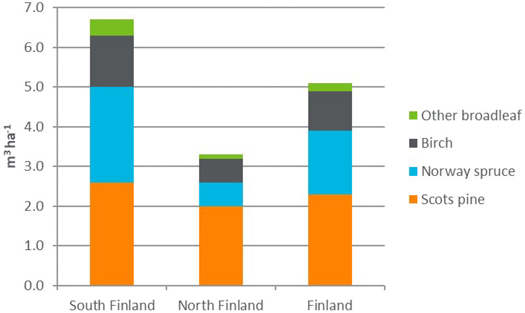
Fig. 15. The annual volume increment in productive forests by tree species according to NFI12 in South Finland, North Finland, and whole country.
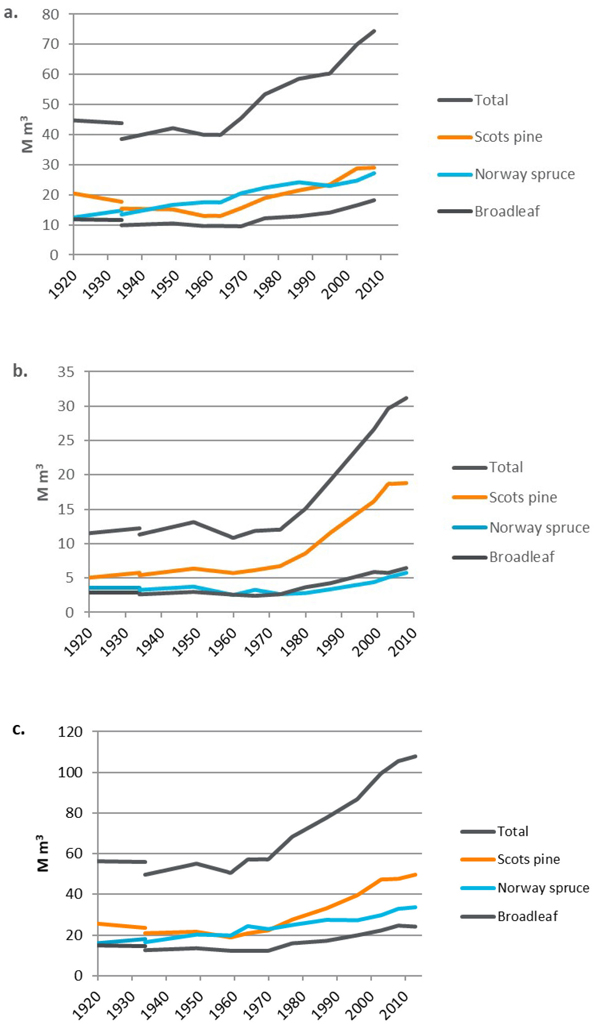
Fig. 16. The annual volume increment (M m3 by tree species in a) South Finland b) North Finland, and c) the whole country 1920–2014. NFI1 estimate is for the territory of Finland of those times, NFI2 estimate for both the current and historical territory of Finland.
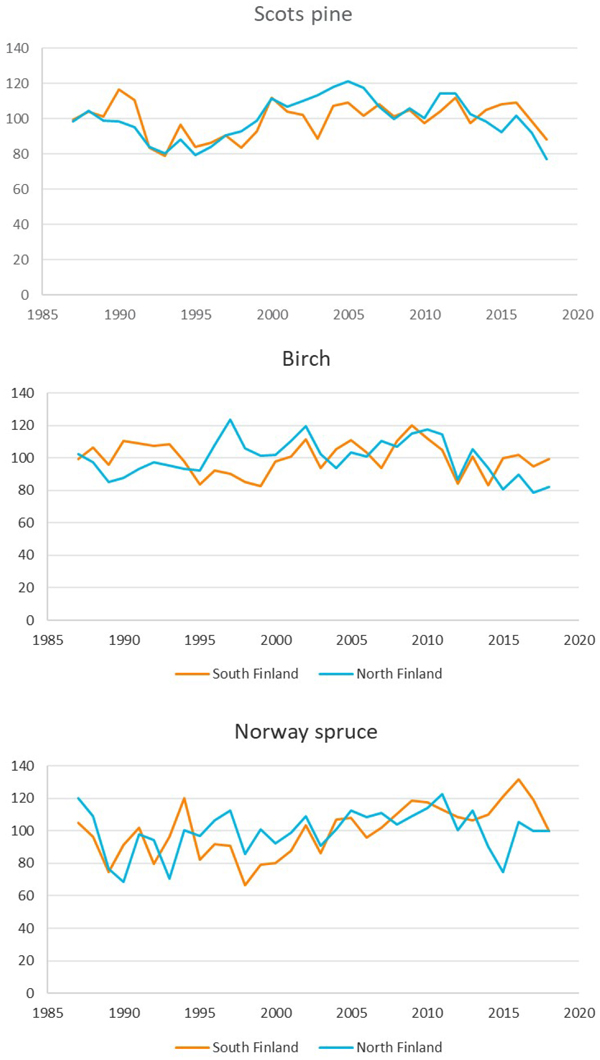
Fig. 17. The increment indices for Scots pine, Norway spruce and birch (silver and downy birch) in South and North Finland.
| Table 4. Average increment indices for the increment measurement periods of NFI11 and NFI12 of Finland (100 = average level of 1985–2018). | ||||||
| Scots pine | Norway spruce | Silver and downy birch | ||||
| NFI | South Finland | North Finland | South Finland | North Finland | South Finland | North Finland |
| NFI11 | 104 | 105 | 110 | 106 | 104 | 104 |
| NFI12 | 104 | 100 | 114 | 98 | 99 | 93 |
| Table 5. Forest balance between NFI11 and NFI12 mid years (2011–2015) for South Finland, North Finland, and the whole country. Notation: GS11 = Volume for growing stock in NFI11, GS12 = Volume for growing stock in NFI12, Difference = Increment–Drain–(GS12–GS11). | |||||||||
| GS11 | Increment | Drain | GS11 +Increment –Drain | GS12 | Increment –Drain | GS12–GS11 | Difference | Standard error of change | |
| A | B | C | D = A+B–C | E | F = D–A = B–C | G = E–A | F–G | ||
| M m3 | |||||||||
| South Finland | |||||||||
| Scots pine | 686 | 154 | 108 | 732 | 713 | 45 | 27 | 18 | 8.5 |
| Norway spruce | 552 | 140 | 115 | 577 | 572 | 25 | 20 | 5 | 9.1 |
| Broadleafs | 326 | 92 | 83 | 335 | 339 | 9 | 13 | -4 | 4.4 |
| Total | 1564 | 386 | 306 | 1644 | 1624 | 80 | 60 | 20 | 14.1 |
| North Finland | |||||||||
| Scots pine | 488 | 96 | 49 | 534 | 530 | 46 | 43 | 3 | 8.6 |
| Norway spruce | 156 | 28 | 14 | 171 | 168 | 14 | 11 | 3 | 5.0 |
| Broadleafs | 149 | 29 | 25 | 153 | 153 | 4 | 5 | 0 | 3.5 |
| Total | 793 | 153 | 88 | 857 | 852 | 64 | 59 | 5 | 10.6 |
| Whole country | |||||||||
| Scots pine | 1174 | 249 | 157 | 1266 | 1244 | 92 | 70 | 22 | 12.1 |
| Norway spruce | 708 | 168 | 129 | 747 | 740 | 39 | 32 | 7 | 10.4 |
| Broadleafs | 474 | 122 | 108 | 487 | 492 | 14 | 18 | -4 | 5.6 |
| Total | 2356 | 539 | 394 | 2502 | 2475 | 145 | 119 | 26 | 17.6 |
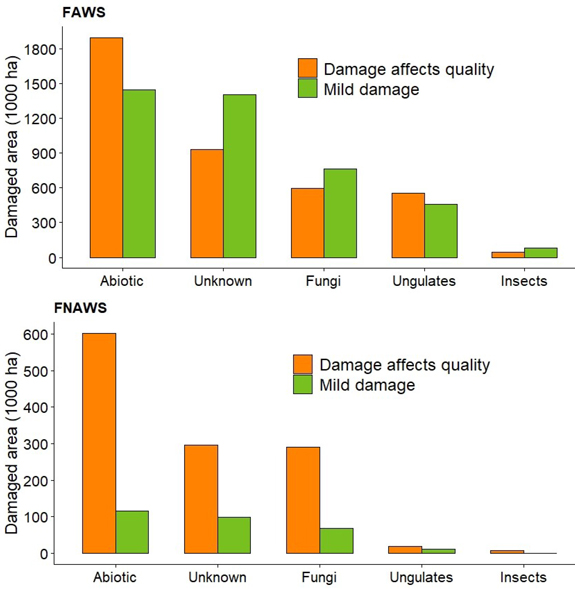
Fig. 18. Area of damaged forest by different damage agent groups in forests available (FAWS) and non-available for wood supply (FNAWS) according to NFI12 in Finland.
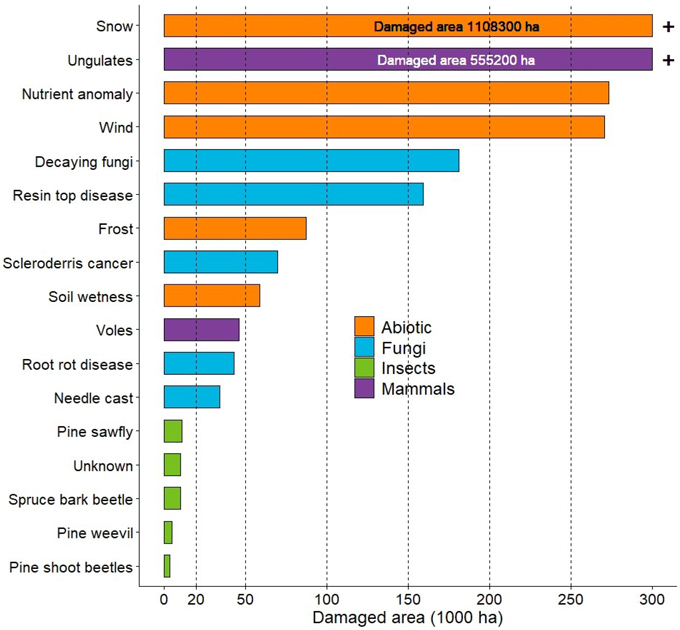
Fig. 19. The most severe damage agents (when measured in terms of area affected) in forests available for wood supply according to NFI12 of Finland. The damage here only includes the quality decreasing damage.
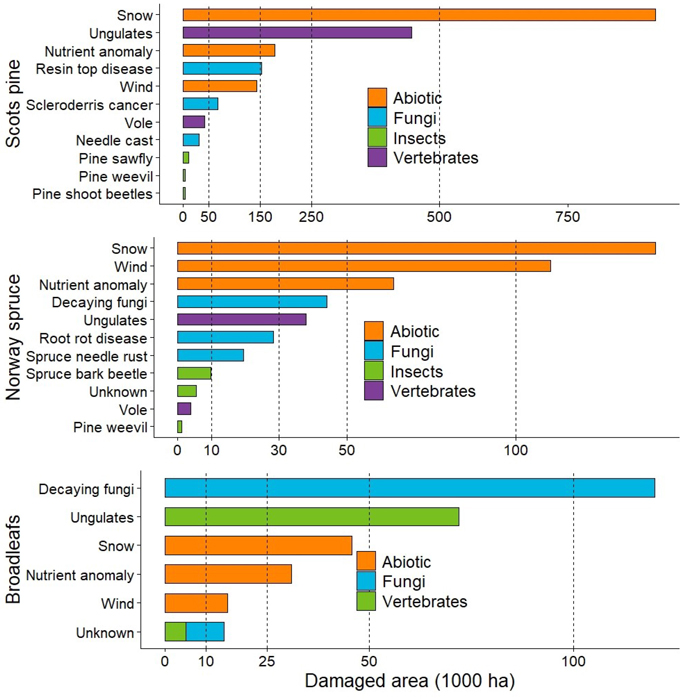
Fig. 20. The most common damage agents (when measured in terms of area affected) in forests available for wood supply by dominant tree species according to NFI12 of Finland. The damage here only includes quality decreasing damage.
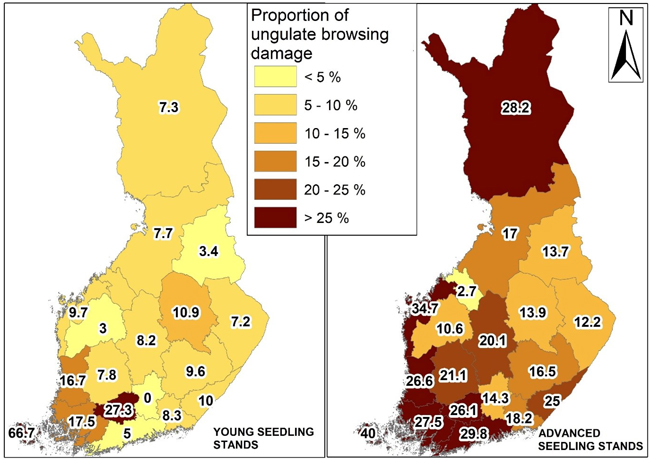
Fig. 21. Proportion of ungulate browsing damage in young (left) and advanced (right) pine dominated seedling stands in Finland by regions according to NFI12. The damage here only includes quality decreasing damage. In young seedling stands the mean height of crop seedlings is < 1.3 m and at least 1.3 m in advanced seedling stands.
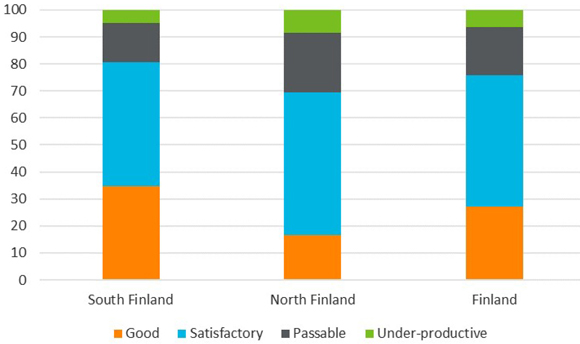
Fig. 22. Proportions of quality classes of the forests available for wood supply in South Finland, North Finland and the whole country according to NFI12.
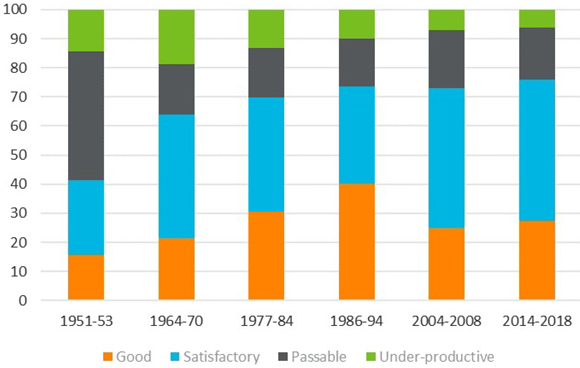
Fig. 23. Area of forests by quality classes in 1951–2018 in Finland. NFI3: productive forest land according to the criteria of those times, NFI5: excluding protected forests, NFI8–NFI12 excluding all forests not available for wood supply.
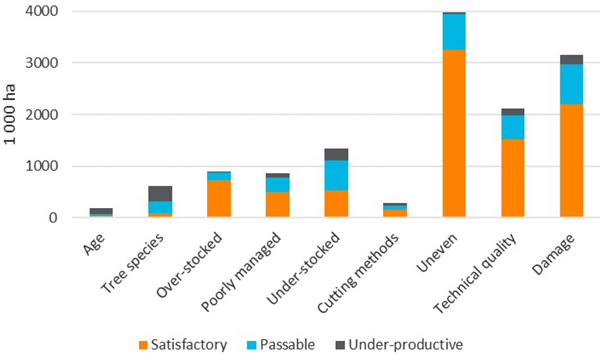
Fig. 24. Area of forests available for wood supply by the reason for degraded quality according to NFI12 of Finland.
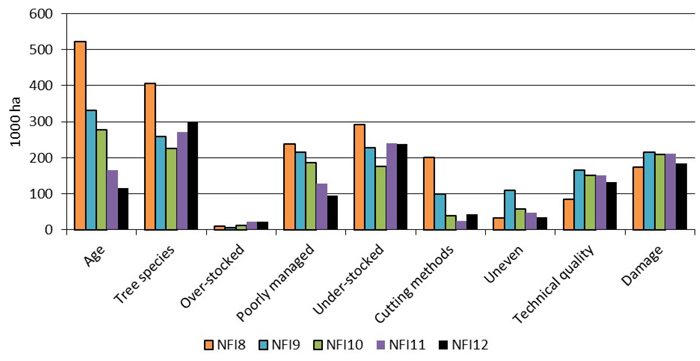
Fig. 25. Reasons for degraded quality in the productive forests available for wood supply in 1986–2018 in Finland.
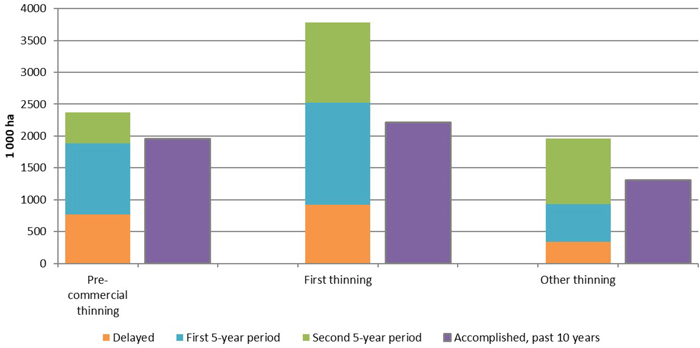
Fig. 26. Accomplished cuttings in the 10-year period before the measurement and proposed cuttings by proposed timing for the coming 10-year period according to NFI12 in Finland. Pre-commercial thinning includes the early management of seedling stands. Delayed thinning means that the quality of forest stand has already decreased due to the delay of the thinning.
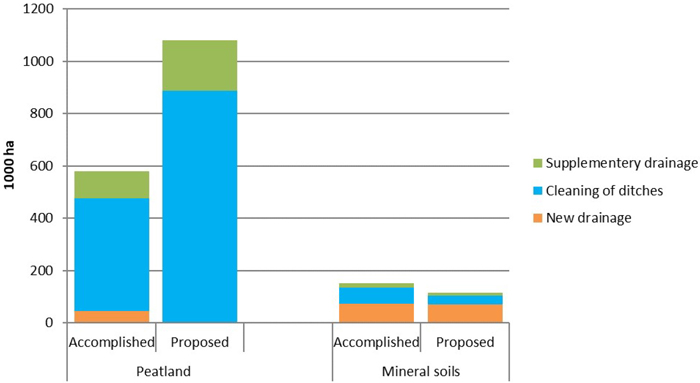
Fig. 27. Accomplished drainage operations in the 10-year period before the measurement and proposed drainage operations for the coming 10-year period according to NFI12 in Finland.
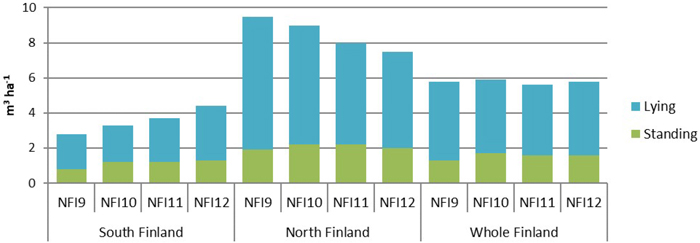
Fig. 28. Mean volume of lying and standing dead wood in productive forests according to NFI9–NFI12 in Finland.
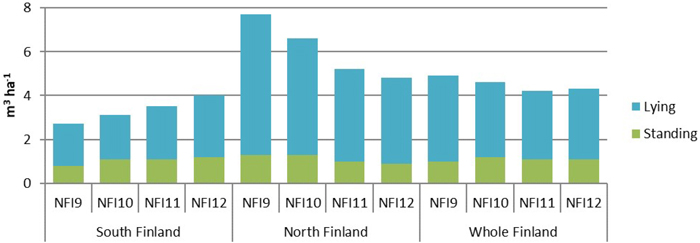
Fig. 29. Mean volume of lying and standing dead wood in productive forests available for wood supply according to NFI9–NFI12 in Finland.
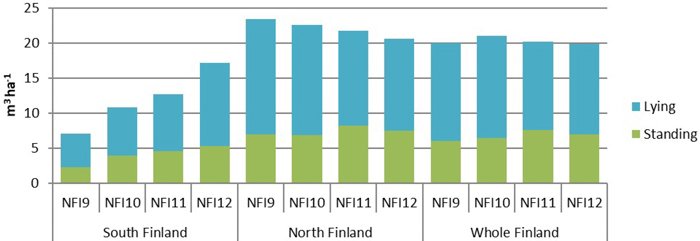
Fig. 30. Mean volume of lying and standing dead wood in protected forests according to NFI9–NFI12 in Finland.
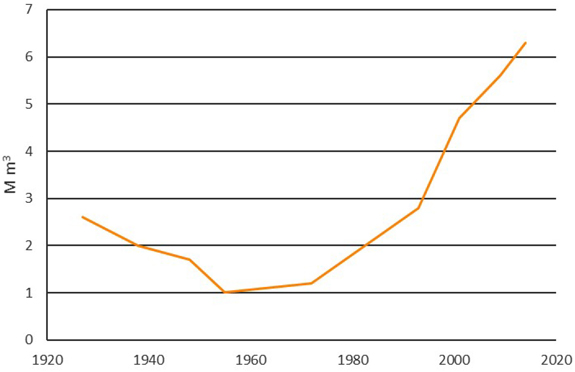
Fig. 31. Estimates of annual natural losses (M m3) 1920–2016 in Finland. Till 1970s the estimates are excluding bark.