| Table 1. Physical and chemical evaluation of the soil profile of a 1 ha fertirrigated cork oak plot in Avis, Portugal. | |||||
| Horizon depth (cm) | Organic Matter (%) | P2O5 (mg kg–1) | K2O (mg kg–1) | Total N (g kg–1) | texture |
| 10 | 3.39 | 86 | 350 | 5.60 | Loam |
| 80 | 0.63 | 7 | 94 | 0.40 | Sandy Clay loam |
| 180 | 0.22 | 5 | 60 | 0.30 | Sandy loam |
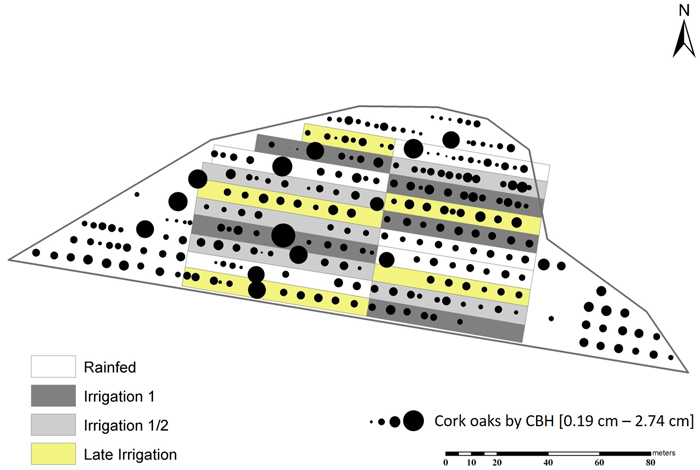
Fig. 1. Irricork: The 1 ha experimental cork oak plot divided by fertirrigation treatments, in Avis, Portugal.
| Table 2. Results of the trees’ dendrometric measurement performed in 2017 at a 1 ha fertirrigated cork oak plot in Avis, Portugal. | |||||
| Trees | CBH (cm) | TH (m) | HCB (m) | canopy projection (m2) | |
| Planted in 2003/05 (mean + S.D.) | Debarked | 75.11 ± 11.04 | 9.26 ± 1.06 | 6.43 ± 0.45 | 20.33 ± 8.03 |
| Non-debarked | 52.05 ± 17.21 | 7.18 ± 1.76 | 4.79 ± 0.49 | 8.52 ± 5.88 | |
| centenary (N. 13) (mean + S.D.) | 214.16 ± 46.20 | 11.29 ± 1.10 | 7.88 ± 0.68 | 136.60 ± 56.87 | |
| CBH = trees’ circumference at breast height; TH = trees’ total height; HCB = trees’ height to canopy basis | |||||
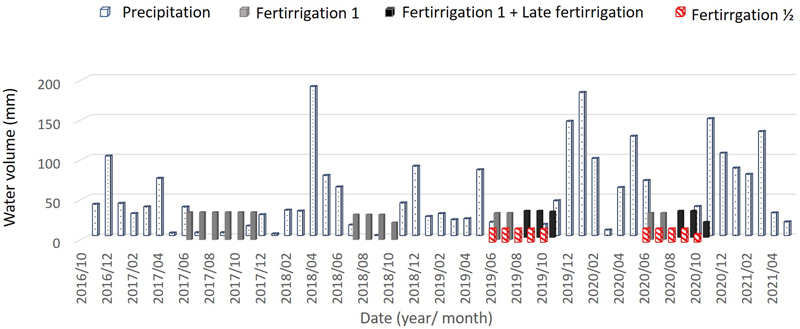
Fig. 2. Monthly volume of total water – Precipitation and irrigation – supplied to the cork oak plot in Avis, Portugal over the study period. In 2017 and 2018 “Late fertirrigation” and “Fertirrigation ½” treatments were watered as Fertirrigation 1.
| Table 3. Resume of daily fertirrigation by treatment during fertirrigation campaign at a 1 ha fertirrigated cork oak plot in Avis, Portugal, between 2017 and 2020. | ||||
| Treatment | Daily fertirrigation (mm) | |||
| Mean | Maximum | Minimum | Standard Deviation | |
| Fertirrigation 1 | 1.29 | 2.91 | 0.01 | 0.78 |
| Fertirrigation ½ | 0.55 | 1.31 | 0.01 | 0.36 |
| Late Fertirrigation | 1.01 | 2.65 | 0.01 | 0.76 |
| Table 4. Resume of collected data and calculated parameters at a 1 ha fertirrigated cork oak plot in Avis, Portugal, between 2017 and 2020. | ||||||
| Variables | Collected data | Average values | Calculated parameters | Average values | Periodicity | |
| Dependent | Trees’ Radial increment at 130 cm height | (0.25 ± 0.21 mm) /15 days | 15–30 days | |||
| Independent | Meteorological | Average Air Relative Humidity (raH) | 71.35 ± 14.77 % | air vapor pressure deficit (VPD) | 1.39 ± 0.88 Kpa | |
| Average Air Temperature (aT) | 15.67 ± 5.60 °C | |||||
| Average Solar Irradiance (SI) | 179.26 ± 81.84 Wm–2 | |||||
| Sum of Precipitation (Prec) | (23 ± 31 mm)/15 days | |||||
| Treatment | Sum of Irrigation | (5.2 ± 7.6 mm)/15 days | ||||
| Subject conditions | Trees cork’ age | Virgin: 16.40 ± 1.02 years | ||||
| Secondary: 2.83 ± 1.30 years | annual | |||||
| Trees Circunference at Breast Height (CBH) | 0.81 ± 0.03 m | Tree Intraspecific Competition (index) | 0.15 ± 0.01 | |||
| Georreferencing | lat, long | initial | ||||
| Table 5. Best fitting model of the curve estimation procedure for the relationship between daily stem increment (cm) at 130 height for each environmental factor, measured in a 1 ha fertirrigated cork oak plot in Avis, Portugal, between 2017 and 2020. | |||||||
| Factors | Equation | M. Summary | Parameter estimates | Tangential ≥ 0 | |||
| R2 | p-value | b1 | b2 | b3 | |||
| Av. raH (%) | Quadratic | 0.16 | <0.001 | 0.050 | –4.2E-04 | ]-∞, 60.11%] | |
| Av. aT (°C) | Cubic | 0.22 | <0.001 | –0.207 | 0.020 | –4.9E-04 | [6.95–20.33] |
| Av. SI (Wm–2) | Quadratic | 0.19 | <0.001 | 2.2E-04 | 5.0E-06 | [–22.46, +∞[ | |
| Av. VPD (Kpa) | Quadratic | 0.20 | <0.001 | 0.004 | –0.001 | ]-∞, 2.05] | |
| D. Prec (mm) | Quadratic | 0.11 | <0.001 | –0.005 | 0.001 | [4.8, +∞[ | |
| Av. = Average; raH = relative air humidity; aT = air temperature; SI = solar irradiance; VPD = air vapor pressure deficit; Prec = precipitation; D. = Daily; M. = Model | |||||||
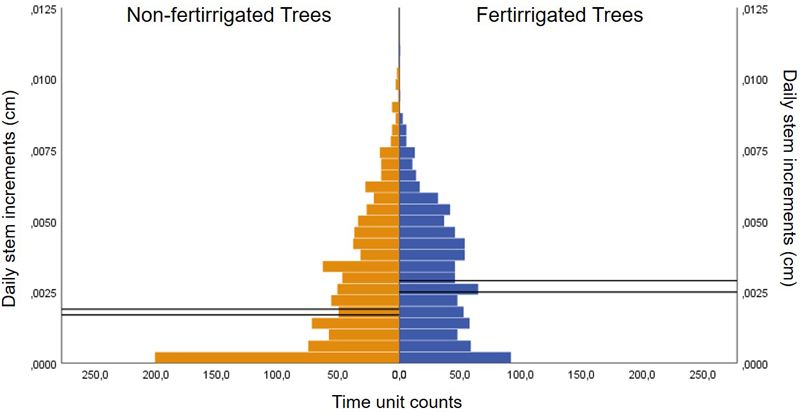
Fig. 3. Pyramid frequency (number of time units) of cork oak daily stem increments under fertirrigated and non-fertirrigated trees at a 1 ha cork oak plot in Avis, Portugal, during fertirrigation campaigns from 2017–2020. Solid lines represent confidence interval for the medians.
| Table 6.1. Generalized linear mixed model estimates of the Independent fixed effects on the daily stem increments (cm) at 130 height measured in a 1 ha fertirrigated cork oak plot in Avis, Portugal, between 2017 and 2020. | ||||||
| Model term | Coefficient | Std. Error | t-student | p-value | 95% Conf. Interval | |
| lower | upper | |||||
| Intercept | –11.117 | 0.208 | –53.351 | <0.001 | –10.708 | –11.525 |
| Cork age (year) | –0.052 | 0.005 | –10.608 | <0.001 | –0.042 | –0.062 |
| Initial CBH (cm) | 0.018 | 0.002 | 8.12 | <0.001 | 0.022 | 0.014 |
| Av. SI (Wm–2) | 0.006 | 0.001 | 11.923 | <0.001 | 0.007 | 0.005 |
| D. Prec (mm) | 0.231 | 0.018 | 13.086 | <0.001 | 0.266 | 0.196 |
| (Daily Prec)2 | –0.009 | 0.002 | –5.119 | <0.001 | –0.005 | –0.012 |
| Av. VPD (Kpa) | 2.588 | 0.129 | 20.093 | <0.001 | 2.841 | 2.336 |
| (Av. VPD)2 | –0.646 | 0.031 | –20.893 | <0.001 | –0.585 | –0.706 |
| D. fertirrigation | 0.218 | 0.037 | 5.93 | <0.001 | 0.291 | 0.146 |
| (D. fertirrigation)2 | 0.019 | 0.014 | 1.385 | 0.166 | 0.045 | –0.008 |
| (D. fertirrigation)3 | –0.018 | 0.004 | –4.966 | <0.001 | –0.011 | –0.025 |
| IC Hh3 | –0.395 | 0.163 | –2.428 | 0.015 | –0.714 | –0.076 |
| CBH = circumference at breast height; Av. = Average; SI: solar irradiance; Prec = precipitation; VPD = air vapor pressure deficit; D. = Daily; IC: Intra-competition; Hh3 = Hegyi Competition index based on competition light cone | ||||||
| Table 6.2. Generalized linear mixed model covariance estimates for residual and random effects (repetitions) with first-order autoregressive structure on the daily stem increments (cm) at 130 height measured in a 1 ha fertirrigated cork oak plot in Avis, Portugal, between 2017 and 2020. | ||||||
| Residual effect | Coefficient | Std. Error | Z-test | p-value | 95% Conf. Interval | |
| lower | upper | |||||
| AR1 Rho | 0.320 | 0.016 | 19.797 | <0.001 | 0.288 | 0.351 |
| AR1 Diagonal | 0.740 | 0.018 | 40.272 | <0.001 | 0.705 | 0.777 |
| Table 7.1. Generalized linear mixed model estimates of the Independent fixed effects on the daily stem increments (cm) at 130 height measured on non-fertirrigated trees from a cork oak plot in Avis, Portugal, during the 2017–2020 Fertirrigation campaigns. | ||||||
| Model term | Coefficient | Std. Error | t-student | p-value | 95% Conf. Interval | |
| lower | upper | |||||
| Intercept | –4.237 | 0.53 | –7.988 | <0.001 | –3.196 | –5.279 |
| Cork age (year) | –0.052 | 0.007 | –7.038 | <0.002 | –0.038 | –0.067 |
| Initial CBH (cm) | 0.011 | 0.004 | 3.165 | 0.002 | 0.018 | 0.004 |
| Av. SI (Wm–2) | 0.013 | 0.001 | 8.947 | <0.002 | 0.016 | 0.01 |
| Av. VPD (Kpa) | –4.142 | 0.405 | –10.216 | <0.003 | –3.346 | –4.938 |
| (Av. VPD)2 | 0.682 | 0.079 | 8.641 | <0.004 | 0.837 | 0.527 |
| CBH = circumference at breast height; Av. = Average; SI = solar irradiance; VPD = air vapor pressure deficit | ||||||
| Table 7.2. Generalized linear mixed model covariance estimates for residual and random effects (repetitions) with first-order autoregressive structure on the daily stem increments (cm) at 130 height measured on non-fertirigated trees from a cork oak plot in Avis, Portugal, between 2017 and 2020. | ||||||
| Residual effect | Coefficient | Std. Error | Z-test | p-value | 95% Conf. Interval | |
| lower | upper | |||||
| AR1 Rho | 0.338 | 0.045 | 7.591 | <0.001 | 0.248 | 0.422 |
| AR1 Diagonal | 0.707 | 0.042 | 16.782 | <0.001 | 0.629 | 0.794 |
| Table 8.1. Generalized linear mixed model estimates of the Independent fixed effects on the daily stem increments at 130 height measured on fertirrigated trees from a cork oak plot in Avis, Portugal, during the 2017–2020 fertirrigation campaigns. | ||||||
| model term | Coefficient | Std. Error | t-student | p-value | 95% Conf. Interval | |
| lower | upper | |||||
| Intercept | –8.512 | 0.95 | –8.964 | <0.001 | –10.376 | –6.648 |
| Cork age (year) | –0.044 | 0.006 | –6.825 | <0.001 | –0.056 | –0.031 |
| Initial CBH (cm) | 0.015 | 0.003 | 5.818 | <0.001 | 0.01 | 0.02 |
| Av. SI (Wm–2) | 0.007 | 0 | 15.612 | <0.001 | 0.006 | 0.008 |
| Av. VPD (Kpa) | 0.034 | 0.807 | 0.042 | 0.966 | –1.549 | 1.618 |
| (Av. VPD)2 | –0.187 | 0.177 | –1.058 | 0.291 | –0.534 | 0.16 |
| D. fertirrigation (mm) | 0.662 | 0.072 | 9.246 | <0.001 | 0.522 | 0.803 |
| (D. fertirrigation)2 | 0.003 | 0.015 | 0.227 | 0.821 | –0.025 | 0.032 |
| (D. fertirrigation)3 | –0.034 | 0.005 | –7.388 | <0.001 | –0.042 | –0.025 |
| CBH = circumference at breast height; Av. = Average; SI = solar irradiance; VPD = air vapor pressure deficit; D. = daily | ||||||
| Table 8.2. Generalized linear mixed model covariance estimates for residual and random effects (repetitions) with first-order autoregressive structure on the daily stem increments (cm) at 130 height measured on fertirrigated trees from a cork oak plot in Avis, Portugal. between 2017 and 2020. | ||||||
| Residual effect | Coefficient | Std. Error | Z-test | p-value | 95% Conf. Interval | |
| lower | upper | |||||
| AR1 Rho | 0.166 | 0.048 | 3.481 | <0.001 | 0.071 | 0.258 |
| AR1 Diagonal | 0.436 | 0.025 | 17.289 | <0.001 | 0.389 | 0.489 |
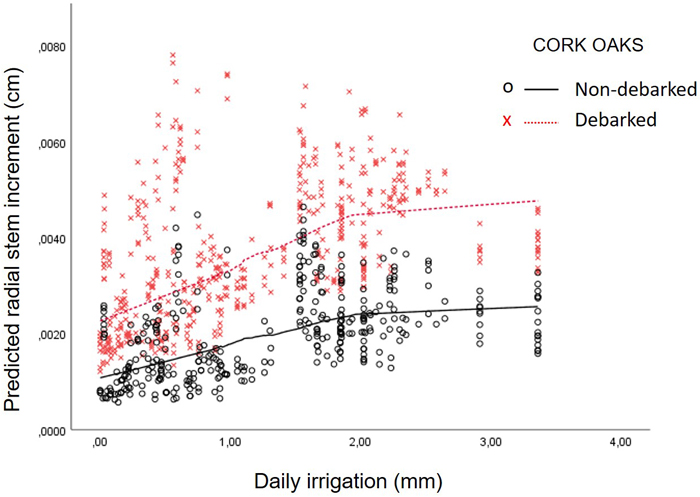
Fig. 4. Relationship between daily fertirrigation (mm) and predicted radial stem increments (cm) at a 1 ha fertirrigated cork oak plot in Avis, Portugal, calculated with the Model 3 “Fertirrigation campaign – fertirrigated trees”, separated by debarked vs non-debarked trees. Lines correspond to Kernel density using Epanechnikov function with 60% points to fit.