| Table 1. Description of the data used for model fitting and model comparison. Data sources were Swedish National Forest Inventory (NFI) and Swedish long-term forest experiments (LFE). Mean values for site index, basal area (m2 ha–1), stem number (stems ha–1) and age (years) are presented for each data set with standard error (SE). | ||||||||||
| Model | Model 1 | Model 2 | Model 3 | Model 4 | Model comparison | |||||
| Species | Scots pine | Norway spruce | Scots pine | Norway spruce | Norway spruce | Scots pine | ||||
| Period length (years) | 1–36 | 1–36 | 5 | 5 | 3–11 | 2–14 | ||||
| Measurement years (NFI/ LFE) | 1993–2017/ 1960–2017 | 1993–2017/ 1960–2017 | 2003–2017/ - | 2003–2017/ - | -/ 1966–2007 | -/ 1966–2007 | ||||
| Fitting | Validation | Fitting | Validation | Fitting | Validation | Fitting | Validation | |||
| Data set | M1F | M1V | M2F | M2V | M3F | M3V | M4F | M4V | GGspruce | GGpine |
| Number of plots | 1288 | 634 | 552 | 284 | 2059 | 1029 | 1422 | 708 | 10 | 10 |
| Number of periods | 5199 | 2599 | 3082 | 1541 | 3307 | 1654 | 2191 | 1095 | 50 | 50 |
| Mean site index | 25 (0.1) | 24 (0.1) | 28 (0.1) | 28 (0.1) | 22 (0.1) | 22 (0.1) | 26 (0.1) | 26 (0.2) | 34 (0.2) | 22 (0.5) |
| Mean basal area (m2 ha–1) | 19.8 (0.2) | 17.2 (0.2) | 36 (0.3) | 21.5 (0.4) | 18.4 (0.15) | 17.8 (0.2) | 24 (0.2) | 24 (0.3) | 36.5 (1.2) | 25 (0.7) |
| Mean stem number (stems ha–1) | 1544 (11.2) | 1621 (20.8) | 2380 (16.1) | 1839 (37.7) | 950 (11.5) | 930 (16.7) | 1149 (16.6) | 1149 (22.2) | 1589 (92.1) | 1424 (72.9) |
| Mean age (years) | 41 (0.2) | 39 (0.3) | 37 (0.2) | 35 (0.4) | 63 (0.6) | 64 (0.9) | 68.8 (0.8) | 67 (1.1) | 43 (1.1) | 59 (1.5) |
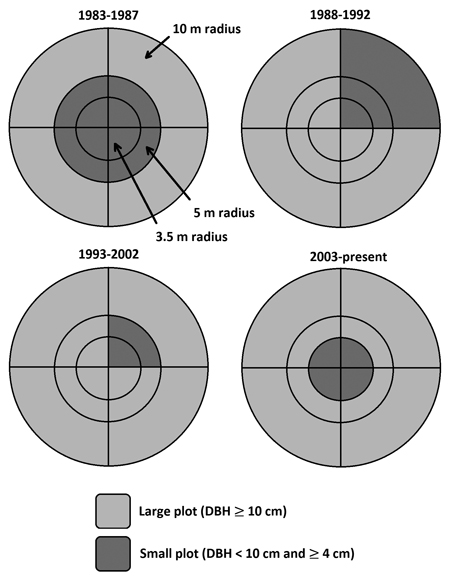
Fig. 1. Permanent plot design for Swedish national forest inventory (NFI) from 1983 to present day. Large plot = all trees with a diameter at breast height (DBH, 1.3 m) ≥ 10 cm was measured with callipers. Small plot = all trees with a DBH < 10 cm and ≥ 4 cm was measured with callipers.
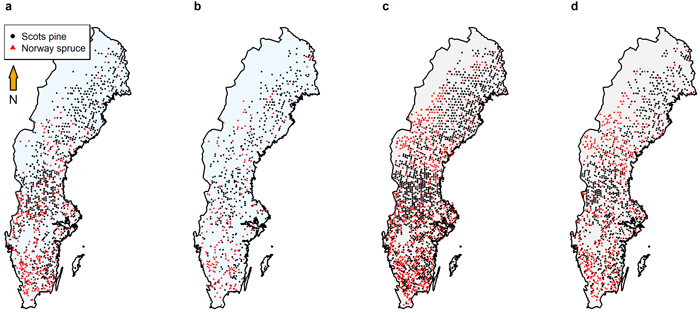
Fig. 2. Locations of the plots used for model fitting and validation for (a) growth and yield model fitting (Model 1 and Model 2; 1288 Scots pine plots and 552 Norway spruce), (b) growth and yield model validation (Model 1 and Model 2; 634 Scots pine and 284 Norway spruce), (c) growth model fitting (Model 3 and Model 4; 2059 Scots pine and 1422 Norway spruce), and (d) growth model validation (Model 3 and Model 4; 1029 Scots pine and 708 Norway spruce).
| Table 2. Definition of variables used in model fitting and validation. Model 1 = basal area growth and yield model (m2 ha–1) for Scots pine in Sweden, Model 2 = basal area growth and yield model (m2 ha–1) for Norway spruce in Sweden, Model 3 = basal area growth model (m2 ha–1 5-years–1) for Scots pine in Sweden, and Model 4 = basal area growth model (m2 ha–1 5-years–1) for Norway spruce in Sweden. | ||
| Variable | Definition | Included in model |
| t1 | Age at period start (year) | Model 1, Model 2, Model 3, Model 4 |
| t2 | Age at period end (year) | Model 1, Model 2 |
| ba | Basal area at period start (m2 ha–1) | Model 3, Model 4 |
| G1 | Total basal area at period start (m2 ha–1) | Model 1, Model 2 |
| G2 | Total basal area at period end (m2 ha–1) | Model 1, Model 2 |
| stem | Stem number (stems ha–1) at the start of the period | Model 3, Model 4 |
| ST | Initial stem number (stems ha–1) before thinning | Model 1, Model 2 |
| veg | Ground vegetation type index (Table 3) | Model 3, Model 4 |
| thinn1 | The thinning grade (Gout/Gbefore) of a thinning performed one period ago. Gout = removed basal area in thinning. Gbefore = basal area before thinning | Model 3, Model 4 |
| thinn2 | The thinning grade (Gout/Gbefore) of a thinning performed two periods ago | Model 3, Model 4 |
| propspruce | Norway spruce proportion of the total basal area (0–1) | Model 3, Model 4 |
| moist | 1 if the soil moisture class is classified as moist, else 0 | Model 4 |
| tsum | Temperature sum(day-degrees > 5 °C), calculated from altitude and latitude (Odin et al. 1983), divided by 1000 | Model 3, Model 4 |
| peat | 1 if the soil is classified as peat, else 0 | Model 3 |
| depthind | 1 if the soil depth is <=0.5 m, else 0 | Model 3 |
| Table 3. Ground vegetation type index (veg) variable definition. Veg-type was the classification use by the Swedish NFI and the veg-index is the veg variable used in Model 3 = basal area growth model (m2 ha–1 5-years–1) for Scots pine in Sweden, and Model 4 = basal area growth model (m2 ha–1 5-years–1) for Norway spruce in Sweden. | ||
| Veg-type classification (Swedish) | Veg-type classification (English) | Veg-index |
| Högört utan ris | Rich-herb without shrubs | 4 |
| Högört med ris/blåbär | Rich-herb with shrubs/bilberry | 2.5 |
| Högört med ris/lingon | Rich-herb with shrubs/lingonberry | 2 |
| Lågört utan ris | Low-herb without shrubs | 3 |
| Lågört med ris/blåbär | Low-herb with shrubs/bilberry | 2.5 |
| Lågört med ris/lingon | Low-herb with shrubs/lingonberry | 2 |
| Utan fältskikt | No field layer | 3 |
| Bredbl. gräs | Broadleaved grass | 2.5 |
| Smalbl. gräs | Thinleaved grass | 1.5 |
| Carex ssp.,Hög starr | Sedge, high | –3 |
| Carex ssp.,Låg starr | Sedge, low | –3 |
| Fräken | Horsetail, Equisetum ssp. | 1 |
| Blåbär | European blueberry, bilberry | 0 |
| Lingon | Lingonberry | –0.5 |
| Kråkbär | Crowberry | –3 |
| Fattigris | Poor shrub | –5 |
| Lavrik | Lichen, frequent occurrence | –0.5 |
| Lav | Lichen, dominating | –1 |
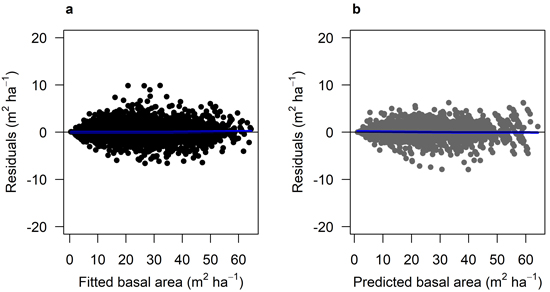
Fig. 3. Residual basal area for Model 1 (Scots pine). a) residuals for the fitted model against fitted basal area (m2 ha–1) using data set M1F, with data from the Swedish national forest inventory and long-term experiments. b) residuals for the model validation against predicted basal area (m2 ha–1) using data set M1V, with data from the Swedish national forest inventory and long-term experiments. The blue lines show the trend in the residuals.
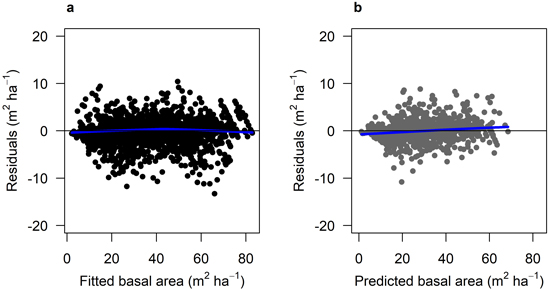
Fig. 4. Residual basal area for Model 2 (Norway spruce). a) Residuals for the fitted model against fitted basal area (m2 ha–1) using data set M2F, with data from the Swedish national forest inventory and long-term experiments. b) residuals for the model validation against predicted basal area (m2 ha–1) using data set M2V, with data from the Swedish national forest inventory and long-term experiments. The blue lines show the trend in the residuals.
| Table 4. Estimated parameters for the growth and yield models and model root mean squared error (RMSE; m2 ha–1) for Scots pine (Model 1) and Norway spruce (Model 2) in Sweden. All estimated parameters were significant at p < 0.05. | ||||||
| Model | RMSE (m2 ha–1) | a | b | c | ||
| Model 1 | Fitted model | 1.404 | Estimate | 4.822 | 0.151 | 0.224 |
| SE | 0.017 | 0.007 | 0.007 | |||
| Validation | 1.472 | |||||
| Model 2 | Fitted model | 2.507 | Estimate | 5.113 | 0.328 | 0.119 |
| SE | 0.018 | 0.022 | 0.009 | |||
| Validation | 2.279 | |||||
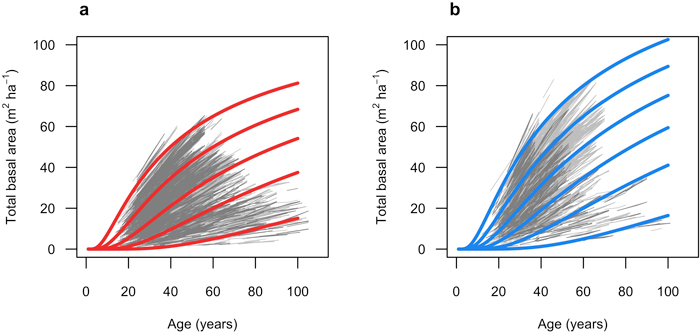
Fig. 5. Predicted total basal area (m2 ha–1) over age (years). a) red lines show Model 1 (Scots pine) when basal area is 65, 50, 35, 20 and 5 m2 ha–1 at 60 years. Light grey lines represent model fitting data (M1F), and dark grey lines represent validation data (M1V). Initial stem number was set to 2000 stems ha–1. b) blue lines show Model 2 (Norway spruce) when basal area is 80, 65, 50, 35, 20 and 5 m2 ha–1 at 60 years. Light grey lines represent model fitting data (M2F), and dark grey lines represent validation data (M2V). Initial stem number was set to 2000 stems ha.
| Table 5. Statistical output of basal area growth models for Scots pine (Model 3) and Norway spruce (Model 4) in Sweden. The response variable was log(G_growth), the natural logarithm of basal area growth over five years (m2 ha–1 5-years–1). The variable exponents were selected to improve variable normality. R2 is the marginal r-square, i.e., a measure of the explanatory power of the fixed effects only. Site was set as random effect. | |||||||
| Model | Coefficient | Estimate | Std. Error | Pr(>|t|) | RMSE | R2 | Random variance |
| Model 3 (Scots pine) | Intercept | 1.547 | 1.260e-01 | < 2e-16 | 0.24 | 0.70 | |
| age10.2 | –1.579 | 3.660e-02 | < 2e-16 | ||||
| ba0.6 | 1.036e-01 | 6.013e-03 | < 2e-16 | ||||
| stem0.2 | 4.105e-01 | 1.745e-02 | < 2e-16 | ||||
| veg | 3.493e-02 | 4.590e-03 | 2.71e-14 | ||||
| thinn10.1 | 2.900e-01 | 1.898e-02 | < 2e-16 | ||||
| thinn20.1 | 2.231e-01 | 1.928e-02 | < 2e-16 | ||||
| peat | –2.808e-01 | 2.519e-02 | < 2e-16 | ||||
| depthind | –5.444e-02 | 1.947e-02 | 0.00470 | ||||
| tsum | 4.417e-01 | 3.422e-02 | < 2e-16 | ||||
| propspruce | 2.898e-01 | 9.098e-02 | 0.00121 | ||||
| Site (random) | 9.245 e-02 | ||||||
| Model 4 (Norway spruce) | Intercept | 5.402e-01 | 1.931e-01 | 0.005195 | 0.29 | 0.69 | |
| age10.25 | –9.577e-01 | 3.531e-02 | < 2e-16 | ||||
| ba0.74 | 5.011e-02 | 3.021e-03 | < 2e-16 | ||||
| stem0.2 | 4.175e-01 | 1.883e-02 | < 2e-16 | ||||
| veg | 8.257e-02 | 5.669e-03 | < 2e-16 | ||||
| thinn12 | 2.014 | 1.704e-01 | < 2e-16 | ||||
| thinn22 | 1.269 | 1.964e-01 | 1.18e-10 | ||||
| propspruce | 3.419e-01 | 9.095e-02 | 0.000175 | ||||
| moist | –1.228e-01 | 4.532e-02 | 0.006770 | ||||
| tsum | 4.032e-01 | 4.340e-02 | < 2e-16 | ||||
| Site (random) | 7.072e-02 | ||||||
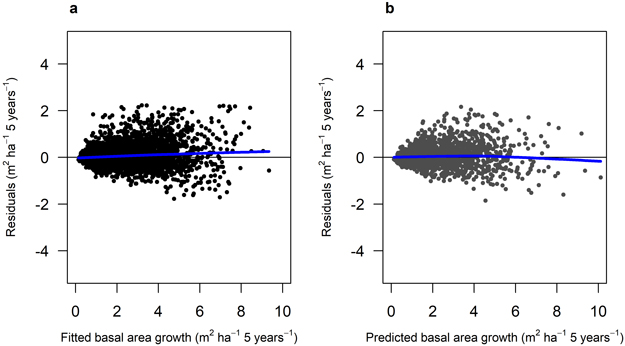
Fig. 6. Residuals for Model 3 (Scots pine). A) residuals for the fitted model against fitted basal area growth (m2 ha–1 5 years–1) using data set M3F, with data from the Swedish national forest inventory. b) residuals for the model validation against predicted basal area growth (m2 ha–1 5 yrs–1) using data set M3V, with data from the Swedish national forest inventory. The blue lines show the trend in the residuals.
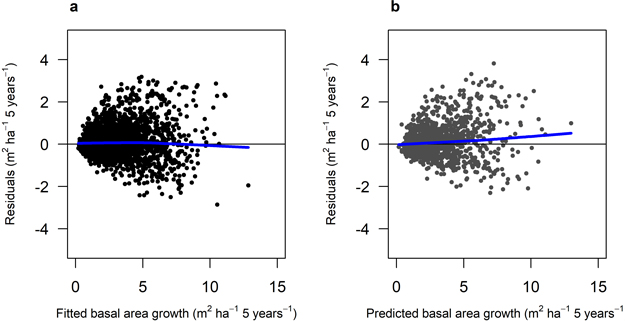
Fig. 7. Residuals for Model 4 (Norway spruce). a) residuals for the fitted model against fitted basal area growth (m2 ha–1 5 years–1) using data set M3F, with data for the Swedish national forest inventory. b) residuals for the model validation against predicted basal area growth (m2 ha–1 5 yrs–1) using data set M4V, with data from the Swedish national forest inventory. The blue lines show the trend in the residuals.
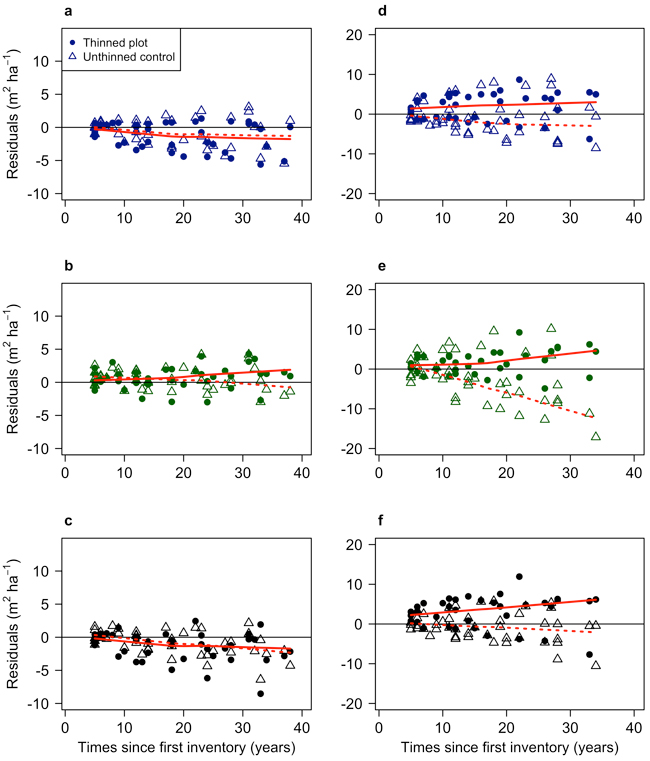
Fig. 8. Residual modelled basal area relative to independent data from the GG experiment as a function of time since first measurement. Plots a, b and c are Scots pine (using the GGpine data set, with data from a Swedish long-term thinning and fertilisation experiment), and d, e and f are Norway spruce (using the GGspruce data set, with data from a Swedish long-term thinning and fertilisation experiment). Plot a (Model 1) and d (Model 2) show residuals for the growth and yield models. Plot b (Model 3) and e (Model 4) show residuals for the growth models. Plots c and f show residuals for Elfving’s model used on Scots pine (GGpine) (c) and Norway spruce (GGspruce) (f). The solid red lines show the trend in the residuals for the thinned plots, and the dotted lines the residual trend for the unthinned plots.
| Table 6. Mean residual bias (%) and root mean squared error (RMSE) for each model and growth period (average 7 years for Scots pine and 6 years for Norway spruce), compared against independent data (GGpine and GGspruce). Model 1 = basal area growth and yield model (m2 ha–1) for Scots pine, Model 2 = basal area growth and yield model (m2 ha–1) for Norway spruce, Model 3 = basal area growth model (m2 ha–1 5-years–1) for Scots pine, Model 4 = basal area growth model (m2 ha–1 5-years–1) for Norway spruce, and Elfving = basal area growth model (m2 ha–1 5-years–1) for Scots pine, Norway spruce, and silver birch. | |||||||||||
| Species | Model | Mean residual bias % (SE) | RMSE (m2 ha–1) | ||||||||
| Period | Period | ||||||||||
| 1 | 2 | 3 | 4 | 5 | 1 | 2 | 3 | 4 | 5 | ||
| Scots pine | Model 1 | 0.35 (0.60) | –1.49 (0.98) | –3.00 (1.28) | –2.44 (1.67) | –7.17 (1.66) | 0.70 | 1.43 | 2.15 | 2.75 | 3.99 |
| Model 3 | 2.55 (0.74) | 1.98 (0.99) | 2.10 (1.12) | 3.58 (1.54) | –1.62 (1.20) | 1.08 | 1.45 | 1.81 | 2.49 | 1.71 | |
| Elfving | 0.92 (0.66) | –1.94 (1.14) | –3.46 (1.25) | –3.77 (1.40) | –8.38 (1.82) | 0.8 | 1.66 | 2.12 | 2.51 | 4.24 | |
| Norway spruce | Model 2 | 0.86 (1.35) | 0.93 (1.63) | 0.78 (1.95) | –0.95 (2.23) | –1.62 (2.73) | 2.32 | 3.32 | 4.29 | 5.30 | 5.55 |
| Model 4 | 1.34 (1.44) | 0.12 (1.92) | –1.04 (2.24) | –3.37 (2.79) | –2.59 (3.35) | 2.36 | 3.81 | 4.98 | 7.1 | 7.9 | |
| Elfving | 2.14 (1.32) | 2.50 (1.58) | 2.023 (1.76) | –0.25 (2.15) | –1.12 (2.83) | 2.4 | 3.44 | 4.19 | 5.28 | 5.64 | |